Table of Contents
1.4 Glucose Response and Satiety
1.7 Protein and Fibre Combinations on Satiety
1.9 Overview of Black – Eyed – Pea Beans – Legumes
2.2 Participants – Recruitment
2.8 Study Outcomes: Subjective Satiety Scores
2.10 Gastrointestinal Tolerance
3.1 Gastrointestinal Tolerance
Table 1 Participants Demographics
Table 2 VAS Scores for Gari and Couscous Test Meals
Table 3 Participants Total Energy kcal for Gari and Couscous
Table 4 Total Protein for Gari and Couscous Meal
Table 5 Dietary Fibre for Gari and Couscous
Table 6 Summary of Monounsaturated Fat for Gari and Couscous
Table 7 Summary of Polyunsaturated Fat for Gari and Couscous
Table 8 Average Nutrients for Gari and Couscous (Postprandial)
Figure 1 Graph Representing Energy kcal for Gari and Couscous
Figure 2 Graph Representing Total Protein for Gari and Couscous
Figure 3 Graph Representing Total Fibre for Gari and Couscous
Figure 4 Graph Representing Total Monounsaturated Fat for Gari and Couscous
Figure 5 Graph Representing Total Polyunsaturated Fat for Gari and Couscous
Figure 6 Graph Representing Average MUFA and PUFA
Figure 7 Chart Representing Average Energy Consumption
Figure 8 Percentage VAS Satiety Levels for Gari and Couscous
Figures 9 VAS Satiety Levels for Gari
Figures 10 VAS Satiety Levels for Couscous
Obesity has attained pandemic proportions with related major health problems and economical burdens worldwide. Therefore, it is vital to understand dietary issues that affect appetite and food intake both in short- and long-term. Thus, the purpose was to evaluate and establish the evidence and determine the effects of dietary intake of high fibre and protein meal of Gari and beans (black eye-pea) and compared to a moderate fibre meal (couscous) on subjective appetite and energy intake at a successive meal. Methodology: randomised controlled trial cross-over treatments where participants were asked to fast over night and consumed a standardised breakfast (toast and butter). Upon arrival at the Food Academy at lunch, they were asked to consume one of the treatments Gari and black eyed pea ad libitum meal. Assessment of appetite and physical comfort was completed immediately using 100 mm Visual Analogue Scale. This procedure was replicated during the second visit for the consumption of control meal (couscous) after one week washout period. Results: There was no significant differences in mean scores at 0 minutes (p>0.05) before treatment, whereas significant differences were noted for subsequent intake 24 hour between the test meal (gari) and control couscous (p<0.05). There was no effect of treatment regarding gastrointestinal measurements. However there were significant differences in appetite scores between gari and couscous meal (p<0.05). Conclusion: gari was shown to offer enhanced subjective satiety over 150 minutes by decreasing subsequent food intake compares to couscous with the bean causing minimal gas and bloating in healthy participants.
Obesity is one of the most severe public health issues worldwide affecting children and adults with critical social, physical and psychological consequences (CDC, 2016). To be overweight and obese is a complex disorder encompassing excessive body fat usually due to the imbalance between energy intake and energy expenditure and is commonly measured using body mass index (BMI) with physiologic factors like: gender; race; age; puberty; size; health; socioeconomic status; parenting style, food composition; portion size; food choice; anxiety; stress and physical inactivity (Pietrabissa et al., 2012). Despite various interventions held and projected to curb obesity, its prevalence is still rising (WHO, 2013) as lack of endorsement exist regarding intake imbalance of energy requirements (Anderson et al., Bellisle 2003; Blundell 2006) due to food quality. Upholding intake equilibrium and a healthy weight is vital; however, satiety and satiation are elaborated schemes controlling desire for food and regulation of ingestion quantity based on nutritional content of macronutrient composition and several other bioactive constituents (Yeomans and Chambers, 2011; Tremblay and Bellisle, 2015). Moreover, complex physiological mechanisms subsist in the body to sustain homeostasis (Woods & D’Alessio, 2008).
Satiation can be described as a series of processes that suggest an end to a period of eating and a path that causes one to stop eating, whereas satiety is the state of restraint over additional food intake once a phase of eating is finished (Blundell et al., 2010). It is the feeling of fullness that endures after eating, suppressing the timing of further consumption of a subsequent meal, given satisfaction to appetite as well as determining the portion size of the meal; hence, a major determinant of total energy intake (Blundell et al., 2010). Although satiety and satiation are simple to define (Blundell, 2006), they are problematic to quantify (de Graaf et al., 2004) because diverse results can be attained depending on the question posed, the study design, and the age and gender of the participants (Anderson et al., 2002, 2003, 2004, Akhavan et al., 2007, 2010, 2011and Bellission et al., 2007, 2008), blurring conclusions (Blundell, 2010).The theoretical structure “Satiety Cascade” for investigating the various dynamics affecting progression was projected by John Blundell and team (Blundell et al., 1987) and has been frequently updated in sequence to incorporate scientific advancements. In the viewpoint of the upward prevalence of obesity worldwide, it is crucial to know how energy balance and bodyweight are managed. The difficulty in balancing energy intake and expenditure is essential to survival, and complex physiological mechanisms have been found purposefully do this, as well as the control of appetite (Hall et al., 2012). The results of the ingested energy, feeds into specific parts of the brain that regulate energy intake, in response to the sensory and cognitive perceptions of what was consumed, and enlargement of the stomach (Veldhorst et al., 2008). These signals are integrated by the brain, and satiation is stimulated. When nutrients get to the intestine and are absorbed, numerous hormonal signals are again integrated in the brain which induces the release of satiety. Adding up to these episodic signals, satiety is also influenced by the instability of hormones, like leptin and insulin, which suggest the intensity of fat stored in the body (Blundell et al., 2012).
Satiation and satiety can be calculated expressly using food intake or indirectly by ratings of personalised sensations of appetite (Havermans et al., 2009). Commonly, universal study design in measuring satiation or satiety over a short period is with a test preload in which the variables of concerned are carefully controlled. This is monitored by participants scoring stages of their appetite sensations, such as fullness or starvation, intermittently and then, after a programmed time break, a test meal at which energy intake is recorded. Prolong-term experiments could propose foods of identified composition to be consuming ad libitum and use measures of energy intake and/or appetite ratings as pointers of satiety. The assessment of satiation and satiety is complicated by the fact that more factors besides these internal pointers might impact appetite and energy intake. Examples are, physical factors, like bodyweight, age or sex, or behavioural factors such as diet or the influence of other people present. Thus, the conventional studies on satiation and satiety are accomplished in the laboratory, where confounders could be safeguarded as much as possible, and are, therefore, of short duration. The effectiveness of satiating power varies amongst various macronutrients because of nutrient-specific hierarchy, even with an identical energy load. For instance, proteins display the maximum potency with carbohydrates (CHO) possessing more satiating power than dietary fats (Veldhorst et al., 2008).
However, several mechanisms might contribute to the eminent satiating significance of protein, such as amplified Diet Induced Thermogenesis, the effects of circulating amino acids, and the discharge of satiety-related intestinal signals like GLP-1 and PYY (). The increase of glycaemia that trails the ingestion of CHO is considered to accounts for satiety. CHO foods that cause a sharp elevated peak in post-ingestive glycaemia may be less satiating compares to low Glyceamic Index (GI) which generates moderate but sustained elevation in glycaemia hours following consumption (Poppitt, 2013). The supposition of combining the two most satiating macronutrients (protein and fibre) would mean an additive or even synergistic effect because each macronutrient and food form carries satiety effects by self-ruling means. While an inadequate number of researches have explored this combination, there is little focused on gari and black eye-pea beans. Any meal has the potential of influencing appetite, thus, it is important to ascertain whether, for a given amount of energy, particular variables have the possibility to promote or reduce satiation or satiety. Much investigation has been conducted on effects of different foods, drinks, food constituents and nutrients on satiety. Overall, the quality of a food or drink that appears to have the most impact on satiety is its energy density () that is the amount of energy it holds per unit weight (kJ/g, kcal/g). Whilst energy density is controlled, the macronutrient composition of foods does not show to have a major impact on satiety. In reality, fatty foods give higher energy density than high-protein or high-carbohydrate foods, and similarly, foods with the highest water content are inclined to have the lowest energy density. Nevertheless, many studies have evidenced that energy from protein gives more satiation than energy from carbohydrate or fat. Further, certain types of fibre have been evidenced to boost satiation and satiety (Rolls, 2000 and Gibbons et al., 2013).
Notwithstanding the reality of complex physiological mechanisms to equate intake to requirements, there are several influences on eating behaviour beyond satiation and satiety. These comprise: portion amount, appeal, palatability and range of foods and drinks offered; the physiological result on the body because of physical activity and sleep; and other external influences such as viewing television and the effect of social circumstances (Biddle and Mutrie, 2008). Micro-nutrients like calcium and vitamins can engage in a modulatory function in satiety. This is evident in calcium supplementation for instance in overweight consumers whose plasma concentration significantly boosted the satiety-related hormone PYY (Jones et al., 2013), whereas, multi-vitamin supplements decrease hunger sensations amongst women who are obese and undergoing weight loss program (Major et al., 2008).
Additionally, non-nutritive components of foods and beverages, like caffeine and capsaicin, can enhance satiety by activating the systematic Nervous System (Westerterp-Plantenga et al., 2005). Notably, individuals differ during responses to nutrient-related satiety. Indeed, the Satiety Cascade recognises the value of the body’s fat-free mass and establishes a person’s metabolic rate directly as it in turn creates a biologically basis for the drive to eat and therefore modulates all facets of appetite, together with hunger, satiation, and satiety (Blundell et al., 2012; Blundell et al.,2015). Because satiation and satiety are necessary in managing energy intake, inter-individual differences in the potency of these indicators and reactivity to their effects could affect potential of obesity. This inconsistency has been researched at a genetic, physiological and behavioural level and might be helpful to use in strategies to avoid obesity. On the whole, it is noticeable that, though the progression of satiation and satiety has the potential to control energy intake, many do not give attention to the signals produced (Veldhorst et al., 2008).
Figure 1:1 the Satiety Cascade Sourced: Adapted from Blundell et al., 2010
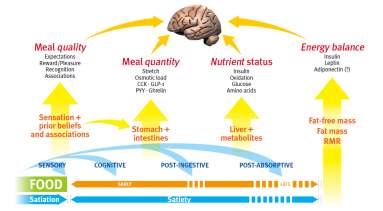
The process involved in satiety work together with the whole length of the gastrointestinal tract and involves chewing and saliva production, nutrient absorption time, gastric distention and stretch, gut hormone discharge ileal brake, transit time and fermentation. From the onset to the late phases of the post-ingestive interval of satiety, there are numerous contributing influences like sensory and cognitive factors that are compelling directly following intake. Gastric causes, such as post-intake stretch and fall in ghrelin, plus the release of diverse hormones, like Cholecystokinin
(CCK), Glucagon-Like Peptide-1(GLP-1) and Peptide YY (PYY) adds to early post-meal satiety followed by elevated circulating levels of nutrients -glucose and amino acids primarily the release of hormones such as insulin sustain satiety pending the return of hunger and the start of the subsequent meal. The body fat mass, through the release of the satiating hormone leptin, and the body fat free mass that establishes the Resting Metabolic Rate, greatly modulate satiety via the following peptides CCK; GLP-1and PYY. Below is the hunger ratings status of ghrelin hours after the consumption of high CHO test meals in comparison with high fat meals.
Figure Sourced: Adapted from (Gibbons et al., 2013)

The yardstick for calculating satiety subjectively uses a visual analog scale (VAS). The use of both multi-point equilateral ratings and 100 mm lines locked with different ends have been certified and therefore good standard for satiety scoring. Objectively, satiety can be measured using this technique because it poses the participant questions that define hunger, fullness, desire to eat, satisfaction and has them put a mark on the line, to the left end meaning “not at all” and the right “the most I’ve ever been”. There are numerous biomarkers correlated with the measurement of satiety but it is difficult to substantiate the quantity and frequency as well as establishing the reason a particular eating pattern. The capturing of satiety is multifaceted and uses multiple time points, consisting time and size of last meal, nutrient content, caloric density, taste, and activity level. Apart from controlling all of the preceding points, the cognitive aspect of eating is one that a researcher has the least control over, also social eating, emotional eating, and availability of foods. In order to control aspects of this variability, researchers implement procedures such as making treatments at random, using overnight fasting before arrival, and having each partaker is in charge of their own control with a crossover design (Flint et al., 2000).
The grading of glycemic index (GI) of a meal is the measurement of a carbohydrate on a scale of 0 to 100 regarding the immediate raise on blood sugar levels over a 2 hour period after ingestion compared to glucose. The scoring offers a grading for diverse foods, but this assessment is biased, in that, there is no consideration regarding the portion size of the particular food consumed. Thus, the glycemic loads is representative for portion size of the meal by using the GI of a food and multiplied by the grams of existing carbohydrate within a portion. The glycemic response (GR) is then the result that the carbohydrate-containing food has on blood glucose concentration all through the digestion progression. The rate at which food carbohydrates are absorbed and digested results in differences in postprandial glycemic responses with the likelihood to impact satiety and appetite. Carbohydrates that are digested and absorbed slower, subsequently results in a slow but sure rise in blood glucose and have been identified to suppress appetite (Bornet et al., 2007 and Thomas et al., 2007) but findings are inconsistent as the rate and degree of carbohydrate digestibility may partly describe the mechanisms (Sands et al., 2009).
Differentials in glycogen stores have also been put forward as an appetite controller. The glucostatic and glycogenostatic schools of thought presume that low blood glucose and depletion of glycogen stores advances to heightened hunger and energy intake (Chaput and Tremblay, 2009). Glucose signalling is known to be similar to leptin signalling as far as its capacity to regulate energy intake and that the current obesity epidemic could be connected to decrease neuroendocrine sensitivity outcome which is less efficient for glucose signal and so higher energy intake (Mobbs et al., 2005).
Evidence assert that, high GI foods have the potency to lower plasma glucose, raises hunger ratings, and incite areas linked with reward and craving in the brain (Lennerz et al., 2013). The capability to extract a lower blood glucose response after a first, low GI meal and also an identical second meal has been phrased the “first-meal” and “second-meal effect”, correspondingly. Besides this GI effect, there is also colonic fermentation and delayed gastric emptying, associated with low GI foods that causes slowly digestible or “lenta” due to fermentable fibre and resistant starches, have also established this effect. Nonetheless, these diverse mechanisms have no effect on all aspects of glycemic control and likewise ingestion (Brighenti et al., 2006; Hlebowicz et al., 2007; Sandhu and Lim, 2008).
Dietary fibre (DF) is an indispensable nutrient in any diet and can promote optimal health in the prevention of cardiovascular health, gut health and weight control.
Embodied in the definition above is the concept of that fibre is enclosed within plants as plant based foods basically contain fibre and when they are consumed as one gains. The categorization of fibres is not as straightforward as soluble versus insoluble since many foods contain a mixture of both (Slavin, 2013) and intake has been highly connected with normal body weight both in animal models as well as in humans (Isken et al., 2010; Tucker & Thomas, 2009 and Du H et al., 2010). There are numerous theories about mechanisms on how fibre could be modulating body weight (Wanders et al., 2011). These proposals include: displacement of high energy dense foods; increasing chewing promoting greater secretion of saliva and gastric juices resulting in higher distension; delayed gastric emptying; interrupted nutrient uptake or digestion; and fermentation (Slavin & Green, 2007). All of the projected processes also include the adaption of various gut hormones which activates a physiological action (Beck et al., 2009; Blom et al., 2005; Cani et al., 2009 and Parnell & Reimer, 2009).
Protein is a requisite macronutrient for all mortals, including humans. The human body needs protein as a source of essential amino acids as foundational blocks of cells and represents the major structural component of all cells in the body.
Protein needs mainly energy input of 20-30% into their developments, whereas fat and carbohydrate require less, at 0-3% and 5-10%, correspondingly. Hence, the fundamental basis that has been proven in connection with its satiating macronutrient, even though the mechanism(s) supporting this is yet to be clarified. One persistent mechanism about protein is its ability to generate the largest thermo-genesis value throughout digestion and absorption compared to fat or carbohydrate. Numerous experiments have shown a larger output of thermic energy after protein consumption compared to fat or carbohydrate. In a 15% protein against a 30% protein meal, the 30% expended 34 kj /hour more than the 15% meal (Johnston et al., 2002 and Westerterp-Plantenga, 2003).
Amino acids are potentially divided because they are bound to metabolise. β- hydroxybutyrate is a essential ketone body that has been proven to decrease food intake (Johnstone et al., 2008) whereas, Leucine and lysine are amino acids that coexist and are associated with improved satiety effects, both of which are ketogenic amino acids, available in whey and might be a mechanism of satiety studied for whey (Westerterp-Plantenga et al., 2012). Although protein is known to induce greater effects on thermo-genesis, its effectiveness relies also its source. An assessment on pork and soy meal to high carbohydrate meal revealed pork having a greater thermic expenditure of 3.9% above the carbohydrate meal when weighed against only 1.9% for the soy meal. Even though thermo-genesis could impact energy expenditure unaided, this in part might explain the evidence behind the yielding of high satiety scores and probable weight loss over a cause of time. Other studies have demonstrated a rise in satiety when partly replaced fat or carbohydrate with greater protein, both at a single meal and within a 24-hour period (Lejeune et al., 2006). As well, High protein lunch offers more satisfaction, less pre-dinner appetite, and less pre-dinner craving compared to a high carbohydrate lunch. 31% extra calories was eaten at dinner with the high carbohydrate lunch compare to the high protein lunch.
Studies on satiety have not been conclusive on the differences of animal protein compared to vegetable protein regarding satiety. The mechanism for protein-induced satiety has so far not been fully explained so the variation between animal protein and vegetable protein leads to a number of puzzling differences that make the results obscure. Notwithstanding detail explanations of what mechanisms are at play, both animal and plant proteins eaten at higher levels in the diet have been linked to increased satiety, declined food intake and greater weight loss (Westerterp-Plantenga et al., 2012 and Barnard et al., 2005).
The premise of mixing the two highest satiating macronutrients would mean an additive or even synergistic effect, because each macronutrient and food form releases satiety effects by independent mechanisms. For instance, a high protein, high fibre snack bars eaten two times a day between meals ended in reduced successive meal intake (Williams et al., 2006).
Gari is a popular West African food staple made from cassava tubers. Cassava, (Manihot esculenta) is a drought-tolerant, starchy, root crop, cultivated in the tropical climates. It is usually consumed in a variety of forms among many families in many parts of subtropical African, Latin America and Asia (Asiedu, 1990; EL-Sharkawy, 2003; Okechukwu and Okoye, 2010). Cassava compares only to the sweet potato as the most notable starchy root crop and it is accepted globally for its trade values as starchy crop, food and animal feed crop. This starchy root acts as a source of industrial starch granules, the main ingredient in chemical processing of ethanol. It is also good for gluten free products and a source of pastries flour. Gari processing occurs when grated cassava roots are compressed and fermented prior to frying to generate a “semi-dextrin food stuff” (Akinlosoye and Babarinde, 2009). This method of heating during the roasting processing is for preservation as it removes the cyanide gas, eliminates enzymes and microorganisms and creates pleasant flavours (IITA, 2005; Montagnac, et al., 2009). The end product is in the form of creamy-white granular flour with a slightly fermented flavour and sour taste, and gelatinized as a result of fermentation (ITA, 2005).
Nutritional Values
Values per 100 grams: Calories 357 kcal; Total Fat 0.15 g; Total Carbohydrate 89.3 g; Protein 1.26 g; Fibre 7.1g
Minerals and Vitamins
Potassium: 33 mg; sodium: 1 mg; Vitamin A: IU 0IU; Vitamin C: 0mg; Calcium: 71mg; Iron: 2.6mg
Black eyed peas/beans (Vigna unguiculata subsp unguiculate) are a major source of protein and part of the legume family. Legumes are loaded with a number of nutrients like protein, complex carbohydrates, dietary fibre and also a considerable level of vitamins and minerals (Coasta et al., 2006). It is pale in colour with an outstanding black spot, medium-sized and grown around the world. They are mostly available dried, frozen and canned and packed with several health benefits. The composition of slowly digestible carbohydrates, high fibre, protein and reasonable energy density present a number of positive traits for a more satiating diet and assistance in weight management (McCrory et al., 2010).
Values per 100 grams are as follows: Calories 90 kcal; Total Fat 0.4 g; Total Carbohydrate 19 g; Protein 13.22 g and Fibre 11.1 g
Potassium: 1148 milligrams; sodium: 48 milligrams; Zinc: 8-11 milligrams; Non-heme iron: 6%; Vitamin C: 1.3 mm; calcium: 41 mg; Folate: 356 mcg and Vitamin A : 26 IU per portion of 171 –g serving.
Due to the mixture of solubility and insolubility nature of the fibre content in legumes, given it a variety of helpful effects (Guillon and Champ, 2002) and can also fuel the release of gut hormones linked to satiety such as GLP-1 (Cani et al., 2009).
Couscous is originally pronounced as ‘Koose-Koose’ is an indigenous dish identified among Northern Africans and is considered to have evolved during the 11th century. Its cultivation originates commonly around North Africa, Southern Europe, and Syria as well as around the Mediterranean Sea, whereas around the States, production takes place in Dakota and Montana, and southern Saskatchewan and Alberta around Canada, (Agriculture and Agri-Food Canada, 2007a). Couscous is a wheat base produce from and is versatile in use for bread, cookies, cakes, noodles, and pasta and rich in carbohydrates and fibre there by boosting it nutritional value (Sestili et al., and FAOSTAT, 2014). However, a variety of grains such as barley, millet, sorghum and corn are used in producing couscous worldwide (Coskun, 2013).
Hypothesis-:
That, the consumption of Gari with Beans (black eye-pea) will induce satiation and sustains satiety levels in an individual for longer and also regulate the postprandial appetite and appetite-related GI responses in healthy normal-weight individuals.
Aim-:
To ascertain, collate, evaluate and establish the evidence of impact on the postprandial effects of dietary fibres and proteins on overall satiety and appetite regulation levels.
Objectives-:
The proposed study is to determine the effects of dietary intake of high fibre and protein meal of Gari and beans (black eye-pea) and compared to a moderate fibre meal (couscous) on subjective appetite and energy intake at a successive meal on satiation and satiety levels by establishing whether the consumption will increase the fullness levels of in an individual in order to evaluate the effects on postprandial satiation and satiety.
The study was randomised controlled trial cross-over design, with participants serving as their own control. This methodology was considered due to its effectiveness in relation to a similar study conducted by Blundell and colleagues on quantitative measurement and standardisation of experimental methodologies that can measure food intake objectively by identifying the effects of diverse foods on satiation and satiety. The team investigated and identified how novel foods and food additives might support satiety in an aid to managing appetite (Blundell et al., 2010).
This is mostly aimed at analyzing assumption that has been framed in advance in the form of a theory. It is more logical and data-led approach which offers a measure of what society think from a statistical and numerical point of view. Quantitative research can collect a large amount of data that can be easily structured and manipulated into reports for analysis (Flick, 2015).
Moreover, using quantitative data has the benefits of justifiability, due to the rigorousness in data collection and the appropriateness of methods and critical analysis to effective its reliability and likewise the application of RCT with its longitudinal dimensions, allows the examination of causal relations between interventions and outcomes (ACAPS, 2012: 6).
As well, Crossover design helped with overcoming the dissimilarity in participants by maintaining the participants as matched as possible, in effect turn into their own ‘test’ and ‘control’. Overall, the design helped make study to be robust; reliable; valid; causal inferences by providing strong empirical evidence for the study. The randomisation ensured there no allocation bias and confounding of unknown variables were minimised as the study was tailored to prove the satiety impact specifically following the consumption of gari (Boutron et al., 2008; Thorpe et al. 2009). Finally, visual analogue scales (VAS) was adopted due to its validity rating by various appetite research groups. In line with this validation, the Leeds group created a device – Electronic Appetite Rating System (EARS), a handheld device for data capturing by using an already existed VAS to enable the assessment on motivation for eating by allowing participants to record their experiences and appetite reliably and conveniently in a chronological tracking of appetite ratings (Stubbs et al., 2000; Flint et al., 2000).
Participants were recruited via face–to-face and college emails. Through discussion, a date was agreed upon following screening to elicit the health status, allergies and dietary intake habits of interested individuals. Eligibility to participate was based on meeting the inclusion and exclusion criteria.
Prior to carrying out the test investigation, signatures on informed consent (Appendix A) were obtained. Upon acceptance, email was sent to each participant regarding instructions on the standardised breakfast before the study visits. Subsequently, participants were asked to keep a record of 24 hour recall dietary intake and consumption of the standardised breakfast prior to the second treatment of the study visit.
A total of 14 participants were enrolled for the study where each participant had two test visits: Gari (fibre + carbohydrate – 30g = 50 kcal) and black eye-pea beans (protein + fibre – 200g = 264 kcal) as the test meal and Couscous (carbohydrate + fibre) with black eye-pea beans (protein + fibre) as the control meal. The study was carried out over a period of two weeks with one week wash period in between. The participants were asked to fast overnight and consumed a standardised breakfast prior the test (toast bread with tea). At lunch time, the participants were asked to consume Gari and black eyed pea beans a meal and Couscous with black eyed pea beans the subsequent week. Furthermore, participants were requested to keep a 24 hour dairy record after consuming each of the test meals for post energy intake analysis. Prior to serving meal, they were asked read through the participation information sheet and signed the consent forms and also to assess their hunger, fullness and desire to eat level by completing the 100 mm visual analog scale. This paper exercise was repeated immediately after consumption up until three hours aftermath where assessments on hunger, satisfaction, desire to eat and overall satiety as well gastrointestinal levels were surveyed.
Participants were screened through a casual face-to-face discussion and then enrolled subject to being healthy and between the ages of 18 – 50. They comprised of male and female students with a healthy weight with maintain weight for last 3 months; non-dieting, not on medications; non breakfast skippers had no record of gastrointestinal disease and were not adhering to any dietary restrictions. Additionally, the study was carried out according to the guidelines laid down and all procedures relating human participants and was approved by the University of Liverpool John Moores Ethics Committee.
Prospective participants excluded if they had any food allergies or conditions where dietary fibre would have exacerbate their condition. Therefore, any: food intolerance, distaste for beans; restrained dietary habits; any history of disease or any significant past medical history including gluten intolerance, on medications regularly; and do not usually eat breakfast or lunch.
Subjects received two isocaloric meals over the two visits. Both meals were prepared in equivalence with weight, calories, total fat (Table 2-2). The gari meal contained 0.2 grams of protein and 1.4 grams of fibre and the black-eye-pea beans contained 15 grams of protein and 8.2 grams of fibre, whereas the control meal – couscous – contained 2.2 grams of protein and 0.7 grams of fibre. These meals were prepared in a food grade test kitchen (Food Academy) using commercially available products and served at the appropriate temperature upon participant’s arrival.
Fasted participants (approximately 4 hours since breakfast) arrived at the Food Academy between 11:45 a.m. and 12:00 p.m. for both tests. Both visits included baseline standardised breakfast prior to test meal. The test meals were served for lunch in a relaxed environment. Also, all leftovers were collected and weighed and data recorded. There was one week wash period separating both visits in an attempt to ensure participants are in a steady condition due to baseline observations elimination of all effects from previous test. Participants were provided with instructions for the completion of the visual analog scale (VAS) form, baseline appetite assessment as well as gastrointestinal survey. The Appetite sensations were rated by VAS at 0, 15, 30, 45, 60, 90, 120, and 180 minutes after baseline. Participants were asked to keep a 24 hour dairy record after consumption of both test meal.
100 mm validated Visual Analog Scales (VAS) was used to measure the subjective satiety ratings (Flint et al., 2000) and served as the principal outcome of the study. Participants were asked to rate their feelings for four satiety related endpoints by questioning: Hunger (How hungry do you feel? 0 mm-I am not hungry at all, 100 mm- I have never been more hungry; Satisfaction (How satisfied do you feel? 0 mm- I am completely empty, 100 mm- I cannot eat another bite; Fullness (How full do you feel? 0 mm- I am not at all full, 100 mm- I am totally full; Prospective food intake (How much do you think you could eat? 0 mm- Nothing at all, 100 mm- a lot (Appendix C).
The energy intakes for both test meals were measured using total kcals for overall energy contained in each at approximately (497). Leftovers were weighed to establish how much was consumed to assist in the calculation of total calories consumed. The 24 hour recorded dietary intakes following consumption test were analysed with Diet-plan 7 for the determination of energy, carbohydrate, fat, protein, and fibre and sodium intake.
The gastrointestinal tolerance of both meals was also measured by subjective scales (Bonnema et al., 2010) by asking specific questions like gas or bloating, nausea, flatulence, diarrhea/loose stools, constipation, gastrointestinal cramping and gastrointestinal rumbling to assess subjective gastrointestinal tolerance on a 4-point Likert scale. The scale adopted a 0-3 rating with 1none, 2- mild, 3- moderate and 4- severe (Appendix 1).
Furthermore, all data were statistically analysed using Statistical Package for Social Sciences version 23.0 software for Windows (SPSS Inc, Chicago, USA) and Paired t-tests were used to determine the effect on overall energy intake following the consumption of gari and beans as well as couscous and beans diet by measuring the differences in hunger response between the two meals. A statistical significance of p<0.05 was used in analysing all statistical procedures. Test meals were analysed using Diet-plan 7 software for the determination of the effects on energy intake, carbohydrate, fat, protein, and fibre content and the overall satiety as well as satiation levels Pallant, 2016).

Table 1 summarises the demographics of the 14 participants: (2 men and 12 women) (n= 14) that took part in the first test (Gari meal) with the average age of 22 (± 2.85 SD) and were perusing Nutrition and Sport Science. However, only twelve completed the subsequent test (Couscous meal). Due to unanticipated scheduling conflicts, two of the selected participants declined participation during the second visit. According to Babbie (2010), when participants drop-out of an experiment; it is termed as experimental mortality or attrition as it can severely compromise a study’s validity, especially when the drop-outs rate varies in comparison to treatment and control group. Hence, <5% loss has been suggested to contribute little bias whereas >20% can potentially pose a threats to validity.


Components within table 2 shows the collated data on satiety levels of both test meals prior to pre and post ingestion using VAS scores measurements in verifying the subjective feelings in determining whether gari meal recorded the greatest satiety effect on peak postprandial responses in substantiating low satiety level and low satiation effect of couscous meal. There was a significant difference in mean scores (p<0.05) time × treatment interactions (p<0.05) observed with average hunger scores between the test meals. At 120 minutes, gari was the only treatment that had significantly lower desire to eat in comparison to couscous meal (p<0.05) as following the treatment, increases in time noted increases with the perceived hunger scores.


Tables (3 – 8) as well as figures (2 – 6) show the breakdown of the two caloric contents, total and average grams of micronutrients of treatments meals: (a) Gari & black-eye-pea beans and (b) Couscous with black-eye-pea beans. The portion size for the gari treatment contained 30g (dried) and consisted of 108 kcal, 0.1 g fat, 0.2 grams of protein and 1.4 grams of fibre, MUFA 0+g, PUFA 0+g and Potassium (K) 133 mg and the black-eye-pea beans portion size was 200g, contained 338 kcal, 15 grams of protein and 8.2 grams of fibre, fat 16.4, MUFA 5.8, PUFA 2.1 and Potassium (K) 562 mg. The portion size for the couscous was 30g (dried), 60g (cooked) and consisted of 107g kcals, 4.3 grams of protein and 1.3 grams of fibre, 0.6 g fat, MUFA 0.1g, PUFA 0.3g and Potassium (K) 92 mg.


Figures (1) and (7, 8, 9, 10) below shown significant variations with a common trend for all the four means at each time point regarding satiety measures for both test meals by indicating a significant increase of progression: lower for hunger at (p=0.01) and prospective food consumption and higher for satisfaction and fullness with the couscous meal compared to the gari mean at (p=0.02). Furthermore, vast differences in mean food intake were evident for both subsequent intakes for rest of the day and 24 hour ingestion postprandial for the gari meal compares to couscous were noted.


 Bottom of Form
Top of Form
Bottom of Form


There was no major difference in the sum of GI symptoms overall as reported occurrences was normal with both meal. However, only three participants confirmed gas and bloating with the beans, however, that is not statistically important.
In line with the concept of satiation and satiety, this study hypothesised on the satiety effect of gari and black-eye-pea beans and the probability in reduction of energy intake following ingestion. Thus, this affected the total food intake at following meal(s) throughout the day – leading to a reduction in total energy consumption all through the day. Hence, over time, these declines could result in weight loss or management eventually. The utilisation of a set of validated question VAS was the best instrument in capturing these subjective feelings of satiety except there are multiples of issues concerning food intake that ought to be measured and managed. Amongst such are: the emotional, hedonic, incentive and social aspects of eating, controlled in the cortex and limbic systems, which have the capacity to reverse the hypothalamic nutrient-sensing control of food intake (Berthound, 2007).
Evidently, the result of this investigation confirmed the hypothesis that, the satiety impact of gari and black-eye-pea beans meal in comparison with couscous black-eye-pea meal with high fibre content are interconnected confirming the high ratings for satiation impact of high fibre. In that, the satiating impact of gari affected couscous as some participants were unable to finish their gari meal, but were able to finish the couscous meal despite both having standardised portion size. Thus, major disparities were established between the two test meals for all the satiety ratings as it peak high hunger levels with couscous when evident considerable variation was observed. At 0 minutes, there was no significant difference in fullness levels for both gari and couscous meal at (p>0.05) and likewise at 30 minutes post ingestion for both test meals. However, there were some significant differences in the mean scores for the fullness level for gari meal (p=004) as oppose to couscous regarding the mean decrease 2 hours time point following consumption. Again, the same significant decrease was observed at the hunger level with gari meal at (p=005) over couscous at the same time point. Meanwhile, at the satisfaction level, significant differences were noted with gari consumption at (p>0.05) during 120 – 150 minutes phases at (p=005) and (p=004) over couscous consumption. Hence, the values at the satiety level concluded that, gari consumption sustained the increase of (p<0.05) in comparison with couscous over the decrease level of satiety from 60 -150 minutes time points at: (p=0.01) and (p=0.02). Furthermore, disparities were observed during the subsequent and post energy intake 24 hours (p<0.05) after the consumption of gari compares to couscous; indicating long-term satiety distinctions between the two meals. Generally, dissimilarities in protein and fibre content have been evidenced to have varying conclusions on overall satiety ratings, yet, higher ratings of fullness have been linked with reduced energy intake throughout day (Holt et al., 2001).
Diets containing protein source have been established to have the potential to impact satiety effects which in consequence aids with weight management due to amino acid content dependant on source being complete or incomplete (Anderson et al., 2004 Costa et al., 2006). So far, there are still uncertainties surrounding the functions of individual amino acids on satiety mechanisms yet, there has been some variations indicated for each amino acid in energy expenditure throughout amino acid catabolism (van Milgen, 2002). Even though animal protein are considered to be of high quality due to its potency for all the limiting amino acids necessary for the body, legumes on the other hand contains the highest content of lysine and threonine as oppose to other plant-sourced proteins, with its correlation to amplified satiety ratings (German et al., 2010; Westerterp-Plantenga et al., 2012). Despite the usual associations of gas and bloated-ness with the consumption of beans, only two participants evidenced such occurrences.
Whether intrinsic or supplemented, the ingestion of fibre has been significantly linked with low body weight with animals and humans equally (Isken et al., 2010; Tucker et al., 2010; Du H et al., 2010). The systems of actions for fibre on satiety for the beans in this experiment comprise: displacement of higher energy dense foods, delayed gastric emptying owing to the integral structure of the fibre-containing whole legumes, absorption and fermentation. Previous investigations have proven that the chief predictor for satiety potential is portion size As such; both the portion size and the calorie content for this study were equally set. Yet, differences were found between the satiety scores for the two meals (Wanders et al., 2011& Slavin & Green, 2007).
Though many demonstrations exist in support of satiety enhancement through food intake reduction within a short time frame in the anticipation of weight loss; there is still unconvincing scientific evidence in support despite existing evidence however regarding diet rich in high-satiety foods facilitating the maintenance of weight loss. Thus, a project by the DIOGENES tracked 773 obese Europeans from eight countries for 26 weeks following a diet-induced weight loss where evaluation of five maintenance diet circumstances was compared to conclude best maintenance emerges by combining a diet with increased protein content and low GI (Larsen et al., 2010).
Besides, whilst many food-associated dynamics affect satiety, responsiveness to satiety signals also varies mostly between individuals. In that, a “low-satiety phenotypes” have been recognized in proportion of obese, nevertheless, normal-weight individuals have been personified by weak changes of appetite sensations subsequent standardised meals (Drapeau et al., 2013). Hence, individuals with a low-satiety phenotype exhibit a higher Resting Metabolic Rate and higher levels of dis-inhibition when measured over those with a “high satiety phenotype” with the former categorised as being prone to overeating and seem as a general markers for susceptibility to universal health issues such as CVD and T2DM. Yet, the causes of these differences have not been identified, although anxiety/stress operates as the probable modulating factors Dalton et al., 2015). Moreover, regardless the availability of vast amount of information; consumers are still unable to discern and optimise their diets as well as intake control but instead, form perceptions from physical cues from psychological states like lack of desire to eat more (Murray and Vickers, 2009). Therefore, for knowledge and understanding of scientific results to be effective and beneficial amongst consumers, there must be improvement in the dissemination with the help of qualified health professionals (Stubbs, 2013).
In view of this, several innovative perspectives on satiety and its mechanisms have emerged recent years. For instance, the composition of the gut micro-biota and how nutrients might affect satiety responses and body weight varies amongst obese and lean individuals (Delzenne et al., 2013). According to Neyrinck et al (2011), evidence on animal studies on high-fat diets noted induced alterations within the composition of the gut micro-biota that help with the development of obesity.
Equally, prebiotics, a category of non-digestible/fermentable CHO that increase gut bifidobacteria, decrease food intake in animal models of obesity, also decreases reduces appetite among humans when evening meals rich in dietary fibres with prebiotic properties following the day in correspondence with an increase in the satiogenic peptide GLP-1 (Johansson et al., 2013). Additionally, the administering of prebiotics supplements to humans raises satiety sensations and decreases energy intake (Cani et al., 2006), stimulates the release of GLP-1 and PYY (Parnell and Reimer, 2009; Verhoef et al., 2011) whereas, in obese persons, reduces body weight, waist circumference, and fat mass (Genta et al., 2009).
Although, these findings are vital inputs to appetite regulation study and consumers alike; it still reveals the inconclusive elements about foods and its assertion to offer appetite suppressing benefits based on their potential physiological outcome on the body (Griffioen-Roose et al., 2011). Yet, this evidence is well-timed as many have become more conscious about their health and are relentlessly hunting for the next ‘miracle’ food which can effectively curb appetite consequential in sustained weight loss despite the complexity surrounding appetite regulation and its reliance on a multiplicity of processes entailing physiological, psychological and environmental factors (Sørensen et al., 2003). Notwithstanding, this study evidenced that Gari successfully suppressed appetite and reduced successive energy intake, it reflects only the effects observed amongst a small sample frame and therefore cannot be generalized. However, findings indicate that Gari, a novel food to this community, could have potential in replacing more commonly consumed refined grains in the British diet. Also, several previous investigations have hypothetically indicated that appetite suppression and effective decrease in energy intake does not necessarily relies on a particular ‘miracle’ food, but by adapting to an array of enduring dietary practices and physical activity habits (Blair, 2009).
Significant improvement in results could have been achieved and not flawed to an extent considering the implications of the following: the Quantity of beans could have affected the result. Also, the fore knowledge on gari and palm oil could have psychologically impacted on participant’s satiety scores due to food neo-phobia (Tuorila et al., 2001) especially with (palm oil) might have affected their inclination to avoid new foods due to biological mechanism of protection against the ingestion of toxins via new and/or unfamiliar foods might have contributed pre-conceived anxiety regarding consumption of new food since assessment on palatability was not investigated. Furthermore, the reduction in sample size – drop-out –rate might have also influence the result and likewise the general biasness regarding food diary recordings impacting overall 24 hour post ingested meals.
Recommendation
Evidently, reported results in satiety researches remain mostly inconclusive owing to different methodologies conducted. Thus, future research design must be modified by incorporating measurement of blood glucose levels of participants throughout the study in order to gain an improved understanding of how blood glucose levels might influence the subjective satiety ratings as research on the combination of Gari with and black-eye-pea consumption are limited. As such, more research surrounding Gari will be reasonable in determining if its consumption can effectively suppress appetite in comparison to other refined grains and consequently uphold health within the population.
In conclusion, this experiment established a variation in both satiety ratings and subsequent food intake between the two test meals of varying fibre content even though they contained same protein content in context of fullness duration regarding the couscous meal. It was discovered that participants were a bit hesitant to indulge in unfamiliar meal; fearing ingestion might cause adverse interactions consequential in the inability in distinguishing between tangible differences.
Moreover, the consumption of the black-eye-peas beans resulted in an episode of gastrointestinal symptoms among three of the participants. To able to draw conclusive suggestions, further studies would be required for confirmation particularly with greater sample sizes to correct potential treatment order interactions. Nonetheless, even though test meals had matched portion size with corresponding carbohydrate load, the subjective satiety scores indicated differences in the satiety potential of gari and couscous, post-ingestion intake was reduced in the case of gari meal than couscous. Through this experiment, a considerable knowledge had been gained from how certain combinations of foods are able to induce satiety. Thus, incorporation of gari in diets could ultimately result in weight reduction and assist in weight management provide agencies and businesses with a platform for discussions on ways to contest obesity and improve manage weight crisis with a variety foodstuff.

Appendix 2:2 Diet Plan Analysis for Couscous

Appendix 2:3 Diet Plan Analysis for Couscous and Beans

Appendix 2:4 Diet Plan Analysis for Gari and Beans

Appendix 3:1 Paired Sample Statistics (Fullness Level)

Appendix 3:2 Paired Sample Test (Fullness Level)

Appendix 4:1 Sample Paired Statistics (How Much Satiety Level)

Appendix 4:2 Paired Sample Test (How Much Satiety Level)

Appendix 5:1 Sample Paired Statistics (Hunger Level)

Appendix 5:2 Paired Sample Test (Hunger Level)

Appendix 6:1 Sample Paired Statistics (Satisfied Level)

Appendix 6:2 Paired Sample Test (Satisfied Level)

You have to be 100% sure of the quality of your product to give a money-back guarantee. This describes us perfectly. Make sure that this guarantee is totally transparent.
Read moreEach paper is composed from scratch, according to your instructions. It is then checked by our plagiarism-detection software. There is no gap where plagiarism could squeeze in.
Read moreThanks to our free revisions, there is no way for you to be unsatisfied. We will work on your paper until you are completely happy with the result.
Read moreYour email is safe, as we store it according to international data protection rules. Your bank details are secure, as we use only reliable payment systems.
Read moreBy sending us your money, you buy the service we provide. Check out our terms and conditions if you prefer business talks to be laid out in official language.
Read more