Data Analysis: Descriptive Statistics and Assumption Testing
Correlation: Descriptive Statistics and Assumption Testing
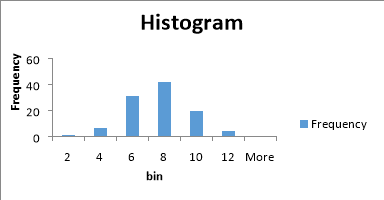
Frequency distribution table
|
bin |
Frequency |
|
2 |
1 |
|
4 |
6 |
|
6 |
31 |
|
8 |
42 |
|
10 |
19 |
|
12 |
4 |
|
More |
0 |
Histogram
Descriptive statistics table
|
Mean annual sick days per employee |
Descriptive statistics |
|
Mean |
7.126214 |
|
Standard Error |
0.186484 |
|
Median |
7 |
|
Mode |
7 |
|
Standard Deviation |
1.892605 |
|
Sample Variance |
3.581953 |
|
Kurtosis |
0.124923 |
|
Skewness |
0.14225 |
|
Range |
10 |
|
Minimum |
2 |
|
Maximum |
12 |
|
Sum |
734 |
|
Count |
103 |
Measurement scale
The minimum and maximum of Mean annual sick days per employee was 2 and 12.
Measure of central tendency
The analysis shows that mean, median, mode and standard deviation of Mean annual sick days per employee was 7.126214, 7, 7 and 1.89 respectively.
Evaluation
The Descriptive Statistics shows that the Kurtosis and skewness of Mean annual sick days per employee is 0.124923 and 0.14225. The assumptions for parametric statistical testing were met here.
Simple Regression: Descriptive Statistics and Assumption Testing
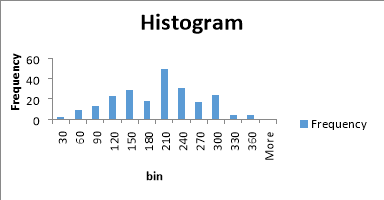
Frequency distribution table
|
bin |
Frequency |
|
30 |
2 |
|
60 |
9 |
|
90 |
13 |
|
120 |
23 |
|
150 |
29 |
|
180 |
18 |
|
210 |
49 |
|
240 |
31 |
|
270 |
17 |
|
300 |
24 |
|
330 |
4 |
|
360 |
4 |
|
More |
0 |
Histogram
Descriptive statistics table
|
lost time hours |
Descriptive Statistics |
|
Mean |
188.0045 |
|
Standard Error |
4.803089 |
|
Median |
190 |
|
Mode |
190 |
|
Standard Deviation |
71.72542 |
|
Sample Variance |
5144.536 |
|
Kurtosis |
-0.50122 |
|
Skewness |
-0.08198 |
|
Range |
350 |
|
Minimum |
10 |
|
Maximum |
360 |
|
Sum |
41925 |
|
Count |
223 |
Measurement scale
The minimum and maximum of lost time hours was 10 and 360.
Measure of central tendency
The analysis shows that mean, median, mode and standard deviation of lost time hours was 188.0045, 190, 190 and 71.72542 respectively.
Evaluation
The Descriptive Statistics shows that the Kurtosis and skewness of lost time hours is -0.50122 and -0.08198. The assumptions for parametric statistical testing were met here.
Multiple Regression: Descriptive Statistics and Assumption Testing
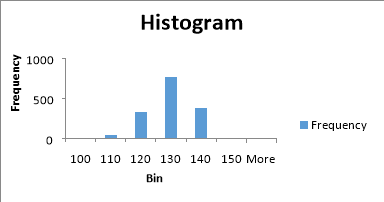
Frequency distribution table
|
Bin |
Frequency |
|
100 |
0 |
|
110 |
36 |
|
120 |
324 |
|
130 |
768 |
|
140 |
373 |
|
150 |
2 |
|
More |
0 |
Histogram
Descriptive statistics table
|
Decibel |
Descriptive Statistics |
|
Mean |
124.8359 |
|
Standard Error |
0.177945 |
|
Median |
125.721 |
|
Mode |
127.315 |
|
Standard Deviation |
6.898657 |
|
Sample Variance |
47.59146 |
|
Kurtosis |
-0.31419 |
|
Skewness |
-0.41895 |
|
Range |
37.607 |
|
Minimum |
103.38 |
|
Maximum |
140.987 |
|
Sum |
187628.4 |
|
Count |
1503 |
Measurement scale
The minimum and maximum of Decibel was 103.38 and 140.9871.
Measure of central tendency
The analysis shows that mean, median, mode and standard deviation of Decibel was 124.8359, 125.721, 127.315 and 6.898657 respectively.
Evaluation
The Descriptive Statistics shows that the Kurtosis and skewness of Decibel is -0.31419 and -0.41895. The assumptions for parametric statistical testing were met here.
Independent Samples t Test: Descriptive Statistics and Assumption Testing
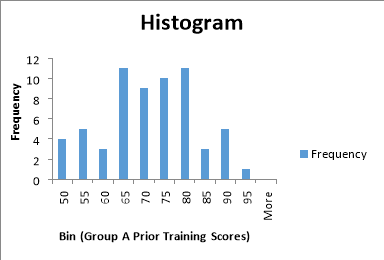
Frequency distribution table
|
Bin(Group A Prior Training Scores) |
Frequency |
|
50 |
4 |
|
55 |
5 |
|
60 |
3 |
|
65 |
11 |
|
70 |
9 |
|
75 |
10 |
|
80 |
11 |
|
85 |
3 |
|
90 |
5 |
|
95 |
1 |
|
More |
0 |
|
Bin (Group B Revised Training Scores) |
Frequency |
|
75 |
2 |
|
80 |
12 |
|
85 |
21 |
|
90 |
19 |
|
95 |
6 |
|
100 |
2 |
|
More |
0 |
Histogram
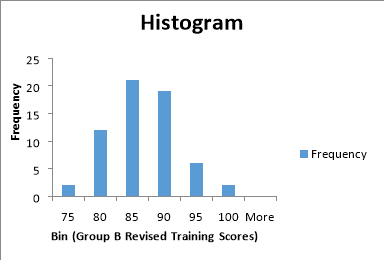
Descriptive statistics table
|
Group A Prior Training Scores |
Descriptive Statistics |
Group B Revised Training Scores |
Descriptive Statistics |
|
Mean |
69.79032258 |
Mean |
84.77419355 |
|
Standard Error |
1.402788093 |
Standard Error |
0.659478888 |
|
Median |
70 |
Median |
85 |
|
Mode |
80 |
Mode |
85 |
|
Standard Deviation |
11.04556449 |
Standard Deviation |
5.192741955 |
|
Sample Variance |
122.004495 |
Sample Variance |
26.96456901 |
|
Kurtosis |
-0.77667598 |
Kurtosis |
-0.352537913 |
|
Skewness |
-0.086798138 |
Skewness |
0.144084526 |
|
Range |
41 |
Range |
22 |
|
Minimum |
50 |
Minimum |
75 |
|
Maximum |
91 |
Maximum |
97 |
|
Sum |
4327 |
Sum |
5256 |
|
Count |
62 |
Count |
62 |
Measurement scale
The minimum and maximum of Group A Prior Training Scores was 50 and 91. The minimum and maximum of Group B Revised Training Scores was 75 and 97.
Measure of central tendency
The analysis shows that mean, median, mode and standard deviation of Group A Prior Training Scores was 69.79, 70, 80 and 11.04556 respectively. Similarly, mean, median, mode and standard deviation of Group B Revised Training Scores was 84.77, 85, 85 and 5.19 respectively.
Evaluation
The Descriptive Statistics shows that the Kurtosis and skewness of Group A Prior Training Scores is -0.77667598 and -0.086798138. It also shows that the Kurtosis and skewness of Group B Revised Training Scores is -0.352537913and 0.144084526. The assumptions for parametric statistical testing were met here.
Dependent Samples (Paired-Samples) t Test: Descriptive Statistics and Assumption Testing
Frequency distribution table.
|
Bin (Pre-Exposure μg/dL) |
Frequency |
|
6 |
1 |
|
12 |
3 |
|
18 |
4 |
|
24 |
5 |
|
30 |
5 |
|
36 |
11 |
|
42 |
9 |
|
48 |
7 |
|
54 |
3 |
|
60 |
1 |
|
More |
0 |
|
Bin (Post-Exposure μg/dL) |
Frequency |
|
6 |
1 |
|
12 |
3 |
|
18 |
4 |
|
24 |
5 |
|
30 |
5 |
|
36 |
7 |
|
42 |
12 |
|
48 |
8 |
|
54 |
3 |
|
60 |
1 |
|
More |
0 |
Histogram
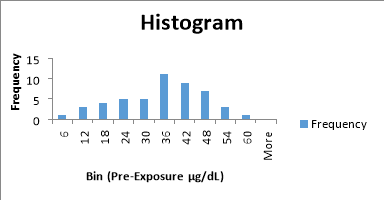
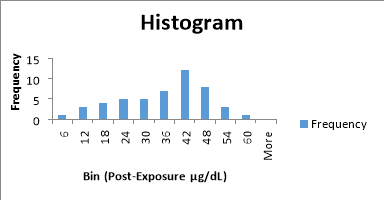
Descriptive statistics table
|
Pre-Exposure μg/dL |
Descriptive Statistics |
Post-Exposure μg/dL |
Descriptive Statistics |
|
Mean |
32.85714 |
Mean |
33.28571 |
|
Standard Error |
1.752307 |
Standard Error |
1.781423 |
|
Median |
35 |
Median |
36 |
|
Mode |
36 |
Mode |
38 |
|
Standard Deviation |
12.26615 |
Standard Deviation |
12.46996 |
|
Sample Variance |
150.4583 |
Sample Variance |
155.5 |
|
Kurtosis |
-0.57604 |
Kurtosis |
-0.65421 |
|
Skewness |
-0.42511 |
Skewness |
-0.48363 |
|
Range |
50 |
Range |
50 |
|
Minimum |
6 |
Minimum |
6 |
|
Maximum |
56 |
Maximum |
56 |
|
Sum |
1610 |
Sum |
1631 |
|
Count |
49 |
Count |
49 |
Measurement scale
The minimum and maximum of both Pre-Exposure μg/dL and Post-Exposure μg/dL was 6 and 56.
Measure of central tendency
The analysis shows that mean, median, mode and standard deviation of Pre-Exposure μg/dL was 32.85714, 35, 36 and 12.26615 respectively. Similarly, mean, median, mode and standard deviation of Post-Exposure μg/dL was 33.28571, 36, 38 and 12.46996 respectively.
Evaluation
The Descriptive Statistics shows that the Kurtosis and skewness of Pre-Exposure μg/dL is -0.57604 and -0.42511. It also shows that the Kurtosis and skewness of Post-Exposure μg/dL is -0.65421 and -0.48363. The assumptions for parametric statistical testing were met here.
ANOVA: Descriptive Statistics and Assumption Testing
Frequency distribution table.
|
Bin (A = Air) |
Frequency |
|
2 |
0 |
|
4 |
2 |
|
6 |
3 |
|
8 |
3 |
|
10 |
5 |
|
12 |
5 |
|
14 |
2 |
|
More |
0 |
|
Bin (B = Soil) |
Frequency |
|
6 |
1 |
|
8 |
7 |
|
10 |
8 |
|
12 |
3 |
|
14 |
1 |
|
More |
0 |
|
Bin (C = Water) |
Frequency |
|
2 |
0 |
|
4 |
2 |
|
6 |
9 |
|
8 |
4 |
|
10 |
2 |
|
12 |
3 |
|
More |
0 |
|
Bin (D = Training) |
Frequency |
|
2 |
0 |
|
4 |
4 |
|
6 |
13 |
|
8 |
3 |
|
More |
0 |
Histogram.
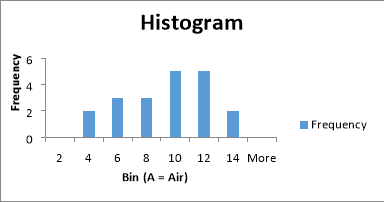
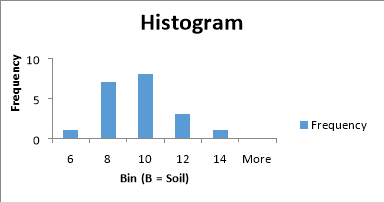

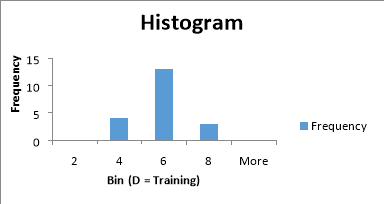
Descriptive statistics table.
|
A = Air |
Descriptive Statistics |
B = Soil |
Descriptive Statistics |
C = Water |
Descriptive Statistics |
D = Training |
Descriptive Statistics |
|
Mean |
8.9 |
Mean |
9.1 |
Mean |
7 |
Mean |
5.4 |
|
Standard Error |
0.684028 |
Standard Error |
0.390007 |
Standard Error |
0.575829 |
Standard Error |
0.265568 |
|
Median |
9 |
Median |
9 |
Median |
6 |
Median |
5 |
|
Mode |
11 |
Mode |
8 |
Mode |
6 |
Mode |
5 |
|
Standard Deviation |
3.059068 |
Standard Deviation |
1.744163 |
Standard Deviation |
2.575185 |
Standard Deviation |
1.187656 |
|
Sample Variance |
9.357895 |
Sample Variance |
3.042105 |
Sample Variance |
6.631579 |
Sample Variance |
1.410526 |
|
Kurtosis |
-0.6283 |
Kurtosis |
0.11923 |
Kurtosis |
-0.23752 |
Kurtosis |
0.253747 |
|
Skewness |
-0.36085 |
Skewness |
0.492002 |
Skewness |
0.760206 |
Skewness |
0.159183 |
|
Range |
11 |
Range |
7 |
Range |
9 |
Range |
5 |
|
Minimum |
3 |
Minimum |
6 |
Minimum |
3 |
Minimum |
3 |
|
Maximum |
14 |
Maximum |
13 |
Maximum |
12 |
Maximum |
8 |
|
Sum |
178 |
Sum |
182 |
Sum |
140 |
Sum |
108 |
|
Count |
20 |
Count |
20 |
Count |
20 |
Count |
20 |
Measurement scale
The minimum and maximum of air was 3 and 14. Similarly, the minimum and maximum of soil was 6 and 13. The minimum and maximum of water was 3 and 12. Similarly, the minimum and maximum of training was 3 and 8.
Measure of central tendency
The analysis shows that mean, median, mode and standard deviation of air was 8.9, 9, 11 and 3.059068 respectively. Similarly, mean, median, mode and standard deviation of soil was 9.1, 9, 8 and 1.744163 respectively. The mean, median, mode and standard deviation of water was 7, 6, 6 and 2.575185 respectively. Similarly, mean, median, mode and standard deviation of training was 5.4, 5, 5 and 1.187656 respectively.
Evaluation
The Descriptive Statistics shows that the Kurtosis and skewness of Air is -0.6283 and -0.36085. It also shows that the Kurtosis and skewness of soil is 0.11923 and -0.492002. Similarly, the Kurtosis and skewness of water is -0.23752 and 0.760206. Moreover, the Kurtosis and skewness of training is 0.253747 and 0.159183. The assumptions for parametric statistical testing were met here.
References
Linoff, G. S. (2010). Data Analysis Using SQL and Excel. John Wiley & Sons.
Whigham, D. (2007). Business Data Analysis Using Excel. OUP Oxford.
Nirel, R., Adar, S. D., Dayan, U., Vakulenko-Lagun, B., Golovner, M., Levy, I., . . . Peretz, A. (2018). Fine and Coarse Particulate Matter Exposures and Associations with Acute Cardiac Events among Participants in a Telemedicine Service: A Case-Crossover Study. Environmental Health Perspectives, 126(9), 097003. doi:10.1289/ehp2596
You have to be 100% sure of the quality of your product to give a money-back guarantee. This describes us perfectly. Make sure that this guarantee is totally transparent.
Read moreEach paper is composed from scratch, according to your instructions. It is then checked by our plagiarism-detection software. There is no gap where plagiarism could squeeze in.
Read moreThanks to our free revisions, there is no way for you to be unsatisfied. We will work on your paper until you are completely happy with the result.
Read moreYour email is safe, as we store it according to international data protection rules. Your bank details are secure, as we use only reliable payment systems.
Read moreBy sending us your money, you buy the service we provide. Check out our terms and conditions if you prefer business talks to be laid out in official language.
Read more