Table of Contents
Titration of water samples to obtain titration curves:
Adding carbon dioxide to water samples:
The effects of carbon dioxide on water ph and alkalinity
Ocean acidification has been an increasing problem ever since the industrial revolution. This is due to increasing levels of carbon dioxide concentrations in the atmosphere and increases in greenhouse gases (Brewer and Barry, 2008). Due to carbonic acid being produced when carbon dioxide reacts with water, an increase in the gas would make the ocean more acidic, causing a reduction in pH over an extended period of time.
As the gas is absorbed into the ocean, the concentration of carbonate ion and saturation states of biologically important calcium carbonate minerals are reduced (this is summarised in Figure 1).Winner (2008) states that, “the increased acidity doesn’t corrode the shells and coral skeleton, rather the excess H+ ions (also known as protons) bond with carbonate ions to make bicarbonate, leaving fewer carbonate ions available for organisms”. This decrease in abundance of carbonate ions results in shell building difficulties for certain organisms, disruption in natural food chains and negative effects on fish respiring behaviours (ESF, 2009).
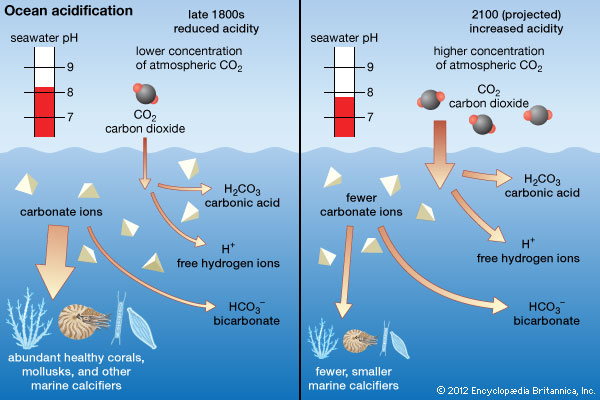
Figure 1: How carbon dioxide affects concentration of ocean ions
Oceans have various compounds within them which provide buffering properties. This buffered solution can resist pH changes when small amounts of acidic or basic substances are added. Due to its neutralisation ability, it is able to relatively maintain the pH of the solution (Fong, 2014). Buffers exist in solutions consisting of a mixture of a weak acid and its conjugate base. These are formed through the dissociation of the compounds into ions, which are usually reversible. The Bronsted-Lowry theory and definition describes interactions between acids and bases in terms of proton transfer between chemicals (Yartsev, 2015). When an acid is dissolved in water, the molecules dissociate, releasing hydrogen-ions (H+) for water to accept. However, when molecules in a base are dissociated in water, hydroxide-ions are released (OH–) (Clark, 2002). As weak acids only slightly ionise in water (rarely donating protons), their weak conjugate bases rarely obtain protons. Thus, they act as a buffer and control the acidity of water by soaking up excess protons (base’s job) and excess hydroxide (acid’s job) when there are unstable amounts. Thus, increase in acidity correlates to increase in protons (Helmenstein, 2016). This could be seen from the chemical equation below where ‘HA’ is an acid which transfers its proton to molecule ‘B’. Thus, molecule ‘B’ acts as a base.

NIWA (2016), states that this natural buffering ability that the ocean possesses is called a carbonate buffer system. The relationship between the components in the ocean’s buffer system can be represented by the equation below:
CO2 atmos ⇌CO2aq+H2O⇌ H2CO3 ⇌H++HCO3- ⇌2H++CO32-
The full relationship could also be seen in Figure 2 below, where a chemical reaction starts with atmospheric carbon dioxide converting to aqueous carbon dioxide.
CO2(aq)then reacts with water to form a weak carbonic acid (equation 1).
This carbonic acid undergoes two de-protonation reactions which are reverible, always trying to achieve equilibrium (a state in which opposing forces are balanced). It first slightly dissociates into bicarbonate and a free
H+ion (equation 2). Increasing the
CO2concentrations favours the forward reaction, thus increasing
H2CO3and
H+.
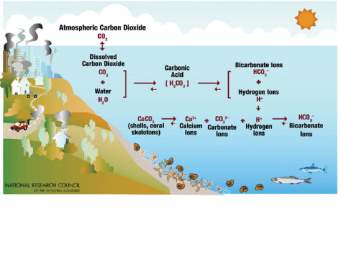 As seen in equation 3 and 4, bicarbonate then dissociates with its proton to form carbonate. Free hydrogen ions also react with carbonate ions which have dissociated from calcium carbonate (from the ocean’s shells and coral skeletons) to produce more bicarbonate ions.
The increased concentration of bicarbonate ions decreases the calcium carbonate concentration due to the favouring of the reverse reaction.
Any pressure/stress on this system in equilibrium causes a shift in a direction that restores equilibrium and relieves the stress – Le Chatelier’s principle (Brennan, 2017). As buffers only contain certain buffering capacities and ranges, when the amount of acid or base that is added exceeds over this limit, the pH begins to change significantly. The increased amount of dissolved carbon dioxide exceeds the natural replenishment rate of carbonate ions. As carbon dioxide concentrations increase, the forward reaction also increases, increasing the bicarbonate and thus, hydrogen ion concentrations. This creates a more acidic ocean and decreased abundance of carbonate ions which could be seen in Figure 1(ASC, n.d.).
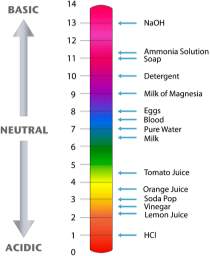 The pH of the ocean is thus, determined by the concentration of hydrogen ions present. A pH scale from 0 to 14 is used to measure the acidity and basicity of a solution, with pH of 7 being neutral (refer to Figure 3 below). PMEL (n.d.) states that “because the pH scale is logarithmic, a change of one pH unit corresponds to a ten-fold change in hydrogen ion concentration.” Thus, although the ocean’s pH has decreased by 0.1 units since the industrial revolution, the small change is considered to be relatively significant.
Figure 3: The logarithmic pH scale
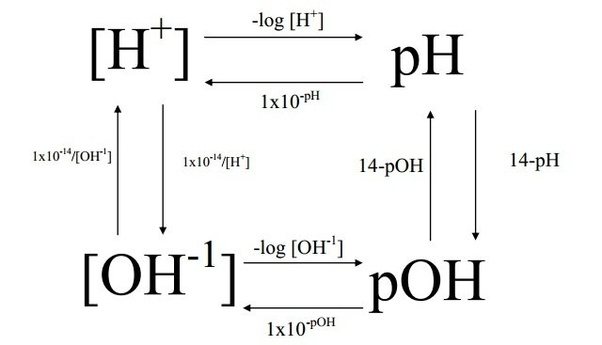
The pH of an aqueous solution can be calculated, if the concentration of hydrogen ions is known, by:
pH=-log10[H+]
pOH on the other hand, is the measure of hydroxide ion concentration instead (Ophart, Emeritus, and McCarthy, 2017). A high pOH means that a solution is acidic, opposite of the pH scale:
pOH=-log10[OH-]
The relationships between hydrogen and hydroxide concentrations on the two scales is expanded in Figure 2 below.
Unlike pH, alkalinity is the measure of the ability of water to neutralise an acid (or hydrogen ions) and resist pH changes (Farley, 2002). The measure provides insight on the processes that alter the carbonate chemistry of the ocean. In order to determine the alkalinity of a solution the following formula is used:
Alkalinity mgL=(mL of titrant)×(Normality of acid)×50 000mL of sample
Where normality (N) is found by:
N=equivalent moles of soluteL
Higher levels of alkalinity means that there are many alkaline substances (buffers) in a water solution, thus, useful in stabilising the pH levels.
In this investigation, experiments were conducted to determine the effects of stress on the buffer systems of ocean water, tap water, and distilled water. The investigation was divided into two different experiments in order to determine the titration curves (by titration using sulfuric acid), and thus the effectiveness of each buffer system, as well as the effects of dissolved carbon dioxide on the pH of water samples. In both these separate experiments, the pH of the sample of water was measured by using a pH probe where a decrease in pH represented an increased concentration of hydrogen ions.
It was hypothesised that the effectiveness of a water system at countering pH change would greatly depend on the alkalinity of the water type. When a stress, such as carbon dioxide, is added to the varied aqueous solutions, the ocean water buffer system would be the most effective at counteracting the changes, in comparison to tap water and distilled water. This is due to ocean water possessing a pH of about 8.1 (National Geographic, 2015) while tap water with 7.2 pH and distilled water around 6.5 pH. The relatively high pH of ocean water suggests that it contains more carbonate and bicarbonate ions, allowing its buffer system to effectively react with increases in hydrogen ions due to the added stress. This would, thus, result in a relatively lower change in pH when tested with dissolved carbon dioxide. Similarly, tap water would also have minerals acting as buffers, unlike distilled water which lacks a buffer system due to its pure nature.

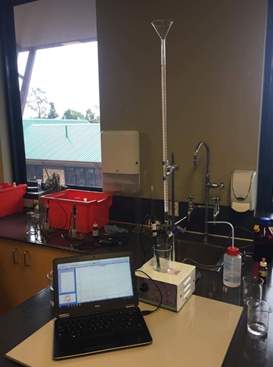
Diagram 1: Experimental apparatus for titration
The probe was calibrated in order to adjust the sensor to its accurate measurements. This was done by placing the probe in known pH values and using these measurements as standards.
 button was pressed to record the input values.
 button was pressed to record the input values.
 button was clicked to begin data collection.
 was clicked.
 button was clicked.
 button was clicked to finish.

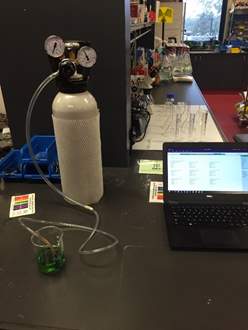
Diagram 2: Experimental apparatus for testing CO2
Table 1: Average values of titration of water samples with H2SO4
| Average values of: | Ocean Water | Tap Water | Distilled Water |
| Starting pH | 8.0 | 7.14 | 6.54 |
| H2SO4 added to get first (or only) equivalence point (mL) | 1.43 | 6.6 | 0.3 |
| First (or only) equivalence point (pH) | 7.79 | 5.47 | 5.07 |
| Total H2SO4 added to get second equivalence point (mL) | 7.3 | — | — |
| Second equivalence point (pH) | 5.05 | — | — |
| Total H2SO4 added to finish curve (mL) | 15.0 | 10.0 | 4.1 |
| Final pH | 3.63 | 3.79 | 3.09 |
* For full titration trial results, see Appendices.
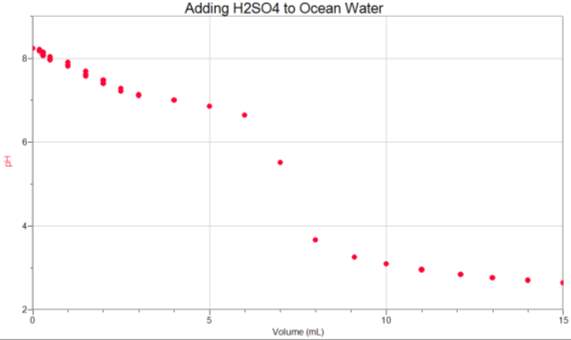
A titration curve visually demonstrates buffer capacity, where times when buffers are working optimally, the curve is flat due to the addition of acid not affecting the pH of the solution drastically. This could be seen in Figure 4 below:
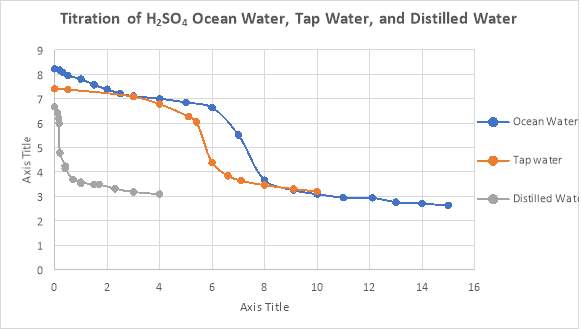
Figure 4: The Titration Curves of the Three Water Samples Tested
* the individual titration curve for each water sample can be found in the appendices.
Figure 4 shows the titration curves derived during the investigation. The graph shows that the amount of acid required for ocean water to reach the final end point is 15mL. This was followed by tap water at 10 mL and distilled water at 3.09 mL. When the titration method was used to determine the titration curves, the controlled variables included the stirring speed and the amount of the water sample being titrated. The independent variable was the amount of sulfuric acid being added into the water samples, whereas, the dependent variable was the capacity of the buffer systems, and thus, the curves produced.
The results from Table 1 were used to calculate the average alkalinity of the water samples, shown in Table 2. Alkalinity was calculated by using the formula:
Alkalinity mgL=(mL of titrant)×(Normality of acid)×50 000mL of sample
Where normality (N) is found by:
N=equivalent moles of soluteL
H2SO4 reacts with 2 OH–, there are two chemical equivalents per molecule
=0.01 mole H2SO4L×2 H+ equivalent1 H2SO4
=0.02
∴Alkalinity =(mL of titrant)×0.02×50 00050
Table 2: The average alkalinity of the three trials tested with three different water samples
| Water Sample | Calculation of Average Values | Alkalinity (mg/L) |
| Distilled water | 1.4*0.02*5000050 | 28 |
| Ocean water | 7.3*0.02*5000050 | 146 |
| Tap water | 6.6*0.02*5000050 | 132 |
* the full calculations for alkalinity of each individual trial can be found in the Appendices.
The alkalinity of these water samples could be seen graphically in Figure 5 below.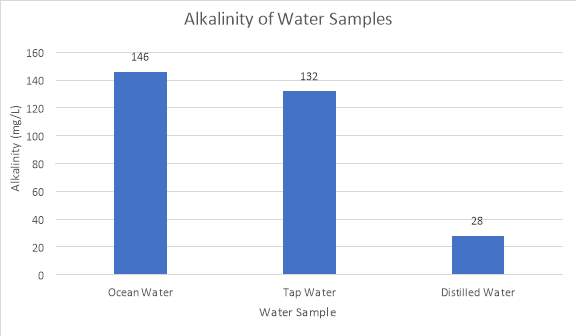
Figure 5: Alkalinity calculated from titrations of water samples
This bar graph indicates that the alkalinity of ocean water was the highest, being at 146 mg/L, whereas tap water and distilled water are 132 mg/L and 28 mg/L respectively.
Table 3: Average pH change when carbon dioxide is dissolved in the water samples
| Water Type | Ocean Water | Distilled Water | Tap Water | ||||||
| Time (sec) | 2 | 4 | 6 | 2 | 4 | 6 | 2 | 4 | 6 |
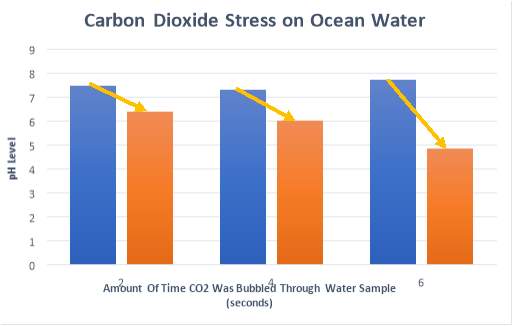
| Starting pH | 7.51 | 7.34 | 7.73 | 6.68 | 6.67 | 6.89 | 7.39 | 7.53 | 7.37 |
| Ending pH | 6.43 | 6.03 | 4.86 | 4.09 | 3.67 | 3.1 | 5.95 | 5.61 | 5.19 |
* For full stress trial results, see Appendices.
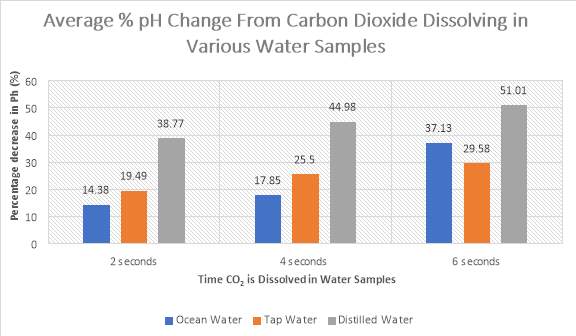
Figure 6: The percentage change from the starting pH and end pH of three samples of water with added CO2
The graph above (Figure 6) shows that ocean water possesses the overall lowest decrease in pH in comparison to tap water and distilled water when carbon dioxide is dissolved in the sample. The calculated percentages can be found in the Appendices.
When the effects of carbon dioxide on the pH change of the water samples were tested, the controlled variable consisted of the amount of the water samples tested. The independent variable was the time that the carbon dioxide gas was bubbled into the various water samples. The dependent variable measured however, was the pH change from before the carbon dioxide was dissolved and after the carbon dioxide was dissolved in the water sample. The dependent variable measured, like the previous experiment, was the amount of carbon dioxide released
Three trials were tested during each experiment in order to increase the accuracy and reduce bias in the data collection methods. As can be seen tabulated, the overall least change in pH when carbon dioxide is added is seen in ocean water, followed by tap water and then distilled water.
The investigation was aimed at determining the effects of carbon dioxide on the buffer systems of ocean water, tap water, and distilled water. The hypothesis that if a water sample possesses a high alkalinity value, then its buffer system would have greater effectivity at countering pH change, was supported by the findings of the investigation. The investigation showed that ocean water was the most effective at counteracting changes, with tap water and distilled water being less and less effective respectively.
The differences in the water samples’ ability to counteract the dissolved acid can be attributed by their difference in alkalinity. Alkalinity can be described as the measure of how much acid can be added to an aqueous solution without causing a dramatic alteration to pH (Oram, 2014). This ability of a solution to buffer against a decline in pH is reliant on the capacity of bases to neutralise hydrogen ions. The results show that a higher alkalinity contributes to slower reduction in pH when stress is applied. Figure 6 displays the effects of carbon dioxide dissolving in the tested water samples. It was clear that ocean water displayed a strong buffer system to counteract the effects of hydrogen ions dissociating in the solution. This could be further supported by the Figure 7 below.

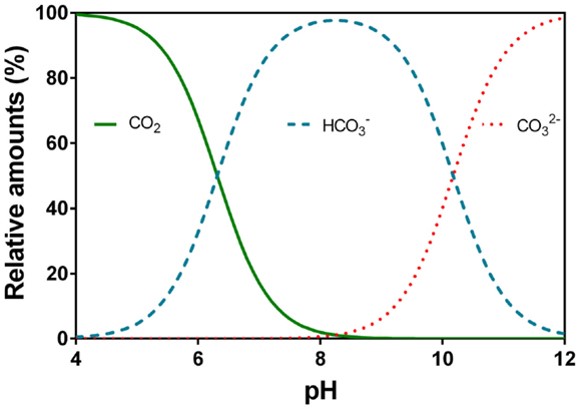
Figure 7: Effects of acid on carbonate species (Source: CARBOEUROPE, 2015)
A more effective buffer system would contain significant amounts of basic minerals or carbonate species. This is due to the species acting as conjugate bases to their weak acids, taking up any additional hydrogen ions released from the dissolved carbon dioxide (Refer to the equation below) (Boundless, 2016).

Furthermore, the ocean water buffer system was the most effective at counteracting the changes due to it possessing a pH of about 8.1 (National Geographic, 2015), while tap water with 7.2 pH and distilled water around 6.5 pH. The relatively high pH of ocean water suggests that it contains more bases such as carbonate and bicarbonate ions, allowing its buffer system to effectively react with increases in hydrogen ions from the added stress. With the current ocean water pH being 8.1, bicarbonate is shown in the graph above to be the dominant species. However, if the amounts of acid increased, the concentration of bicarbonate ions and hydrogen ions would also increase to absorb the stress. The bicarbonate would then dissociate into hydrogen and carbonate ions, increasing the overall acidity and lowering the pH levels.
In Figure 4 it could be seen that when testing for alkalinity, ocean water required the most amount of sulphuric acid to achieve neutralisation, with the addition of 7.3 mL required on average. This is due to the original amount of carbonate species being at excess concentrations in the sample. Species of these kinds can be released into the ocean environment from limestone rocks, reefs and corals present in the natural ecosystem, providing the sample with an alkalinity value of 146 mg/L.
As can be seen from Figure 6, the addition of carbon dioxide increased the free hydrogen ion concentration (Clark, 2002), producing greater amounts of carbonate which are able to bond to protons to form bicarbonate (equation below).
H++CO32- ⇌HCO3-
However, the ability of ocean water to counter the stress applied is reduced as bicarbonate concentration increases. This could also be seen in Figure 6 where increases in the time at which carbon dioxide is added, resulted in a larger percentage pH change from 14.38% to 37.13%. As the amount of hydrogen ions increases excessively, the forward reaction of equilibrium also increases to produce double the amount of hydrogen ions and carbonate ions, further decreasing the pH level (ASC, n.d.). From the equation below, by applying Le Chatelier’s Principle, it could then be seen that the equilibrium shifts back to the left (reverse direction) to counteract the increase in hydrogen ions (stress).
H++HCO3- ⇌2H++CO32-
As the concentration of bicarbonate increases, the overall availability of carbonate ions to produce calcium carbonate decreases, depleting the building blocks of calcifying organisms including shells and coral skeletons (as displayed below as the reverse reaction). This also affects the ocean’s natural buffer system as carbonate ions act as the conjugate base required to neutralise the acidic carbon dioxide.
Ca2++CO32-⇌CaCO32-
A similar curve to Figure 4 below represents the titration of buffered solution by an acid. The three regions depict the neutralisation capacity, with respect to change in pH. Ocean water should, however, display two equivalence points representing the addition of acid converting carbonate to bicarbonate, and bicarbonate converting to carbonic acid with further addition of the acid (OpenStax, 2016). The second equivalence point of ocean water (Figure 4) approximates that the ability of the sample to resist change in to a pH of 5.05.

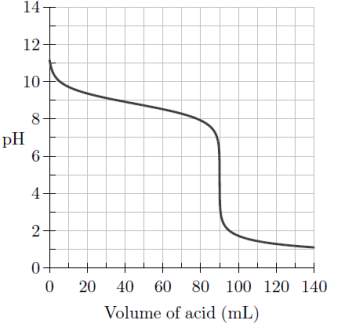
Figure 8: The titration of buffered solution by an acid (Source: chegg.com)
Unlike ocean water, tap water does not contain strong components which prevent drastic changes in pH. Rather, it contains minerals which have effects on the sample’s susceptibility to buffer pH. Greg (2013), states that tap water usually contains calcium and magnesium carbonates and bicarbonates added in from water factories, which consume excess hydrogen ions, thus slightly raising the initial pH. Therefore, these strong bases added are able to neutralise added stresses such as carbon dioxide, not creating a buffer system but producing neutralisation reactions which prevent significant changes in pH (Shapley, 2012). From Figure 6, it could be seen that on average, tap water possesses the second lowest percentage pH change (after ocean water). Furthermore, from Figure 5, tap water could also be seen with the second highest alkalinity value of 132 mg/L, being able to resist changes in stress nearly as well as ocean water.
Distilled water displayed very little buffering capacity as supported by Figure 5 due to its low alkalinity value of 28 mg/L, indicating a weak ability to resist pH change. This is due to the pH nature of the sample being ‘neutral’ and lacking basic minerals to act as buffers, resulting in concentrations of hydroxide ions equalling hydronium ions. Thus, as supported by Figure 4, when introducing a stress such as CO2 to the sample, rapid decrease in pH resulted immediately. Figure 6 further illustrates that distilled water experienced the most rapid change in pH during all three time trials of 2, 4, and 6 seconds. The equation below shows how adding the gas to water results in formation of carbonic acid, raising the concentration of hydrogen ions.

Since pure water is an amphoteric substance, it is able produce a neutralisation reaction when reacted with itself, self-ionising (OptiPure, n.d.). Thus, when carbon dioxide is added, there should be no reaction due to the lack a weak acid and a conjugate base.
There were a few limitations which were caused by errors and uncertainties that likely hindered the reliability of the results. The error that was likely to have had significant impacts on the outcome of the experiment was the accuracy and control of the pH probe. The pH probe may not have been fully calibrated, leading to inaccurate pH measurements and ultimately, corruption of data points on the titration curves. Post-experimental research found that for most accurate measurements when using electrode pH meters, it is suggested that calibration should be conducted each time a new set of measurements are performed (Arrow Scientific, 2013). In the experiments conducted, the calibration method was only conducted twice near the beginning of the investigation, this would account for the inconsistent starting pH reading of the water samples tested. Furthermore, due to rinsing of pH probes with distilled water after calibration, the calibration environment (buffer solution) in which the probe enters may be cross contaminated. As pH buffer solutions are designed to be buffering at their advertised pH values, contamination would render them useless (Digital Analysis, 2016). After rinsing the probe with distilled water and placing it into the buffered environment, the solution may become diluted, raising the solution’s theoretical pH and thus, incorrectly calibrate.
In addition to the potential errors, an anomalous data during the investigation must be addressed. An anomaly could be clearly seen in Figure 6, where the average percentage decrease in pH of ocean water with 6 seconds of carbon dioxide dissolved was higher than that of tap water. This was not expected as theoretically, ocean water contains a stronger buffer system, reducing the effects of added stress. This may have occurred due to contamination of glassware that contained the water sample. Other substances such as water left from rinsing or previous testing may have acted in a way that diluted the sample. In addition, the anomaly may also be due to inconsistent insertion of carbon dioxide from the canister. The canister may be opened with more pressure for each trial, producing more carbon dioxide into the water sample and thus, reducing the pH unexpectedly.
If this investigation was to be repeated, increased reliability of the results may be achieved by improving the overall accuracy and consistency of obtaining data. Alternatively, by calibrating the pH probe before every test day, the accuracy of the data would significantly increase. Furthermore, utilising a closed environment when testing the effects of carbon dioxide on the water samples would provide a reliable pH change, preventing escape of any undissolved gas. This could be done by covering the top of the test beaker and creating small, air-tight openings to insert the carbon dioxide canister tubing and pH probe. Moreover, further trials for each titration of water samples as well as trials including stress could be conducted. This would produce a more reliable and accurate average, reducing any anomalies in data collection. More time could also be given for the pH probe to stabilise, producing a more accurate representation of the pH reduction as it will allow any slight changes in acidity to adapt to the surrounding environment.
Due to the top layer of the world’s oceans directly mixing with the carbon dioxide in the atmosphere above it, as the amount of carbon dioxide gas increases due to increased pollution, more and more of the toxic gas is dissolved into the ocean, disrupting equilibrium. Due to excess dissolved carbon dioxide forming excess carbonic acid, the world’s oceans slowly decrease in alkalinity and pH (Cheek, 2014). Oram (2014) states that alkalinity is important to survival of fish and aquatic life as it protects/buffers against rapid pH changes that may affect their ecosystem. Living organisms usually function best in a pH range of 6.0 to 9.0. Thus, when the pH drops and the carbonate ion concentration is reduced, disappearance or death of marine organisms is at risk. This ultimately contributes to food shortage as acidic waters will have devastating effects on the agricultural production, increasing soil acidity.
In addition, shell relying organisms and corals depend on this concentration of carbonate ion, a deficiency directly correlates to shell building difficulties (ESF, 2009). They require these chemical species to make calcium carbonate shells and skeletons, protecting themselves from the environment around them (Rinkesh, n.d.). Winner (2008) states that, “the increased acidity doesn’t corrode the shells and coral skeleton, rather the excess H+ ions (also known as protons) bond with carbonate ions to make bicarbonate, leaving fewer carbonate ions available for organisms”. When these species are endangered, the entire natural ocean food web is put at risk and may become disrupted.
A future extension to this investigation may involve experimenting with factors such as temperature, concentration, or addition of pure water and the effects they may have on the alkalinity and buffering capacity of different water samples. For example, Cheek (2014) states that due to physical processes such as cooling of surface water of the Arctic Ocean, the surface water sinks towards the bottom of the water body. When this colder and denser water sinks, it sequesters atmospheric carbon dioxide in the ocean, resulting in a much lower pH and concentration of carbonate ions compared to other world oceans. Furthermore, due to carbon dioxide being much more soluble in cold water, it is easier for this type of ocean to take up more of the gas (University of Southern Denmark, 2014). Thus, cooler water temperatures may reduce the buffers’ effectiveness at countering reductions in pH and absorption of dissolved carbon dioxide.
The purpose of this investigation was to determine the effects of carbon dioxide stress on the ability of ocean water, tap water and distilled water to resist changes in pH. Overall, the results suggest that ocean water possesses the highest buffering capacity as displayed from the alkalinity values obtained in the investigation, which is 146 mg/L for ocean water, followed by tap water with 132 mg/L, and distilled water at 28 mg/L. Thus, the results support the hypothesis that the effectiveness of a buffer system at resisting pH change is dependent on the alkalinity of the aqueous solutions, and that the best buffer system is ocean water as derived by the least amount of percentage pH change and the high amount of carbonate species present. Further studies and investigations may focus on how factors such as temperature and saturation state may affect the buffering capacity of different oceans or bodies of water (e.g. pool water or lake water).
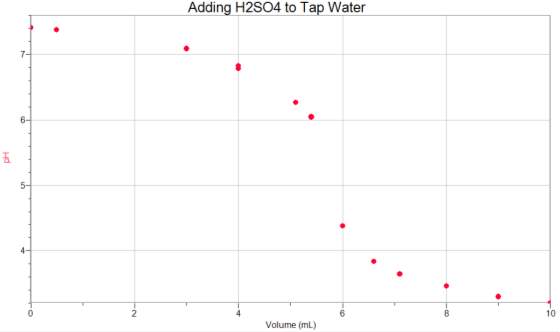
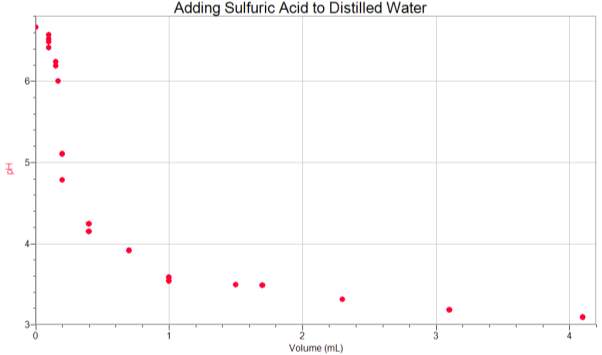
Calculations for the alkalinity of each trial for the titration method using sulfuric acid.
| Distilled Water | Test 1 | Test 2 | Test 3 | Average Values |
| Calculations | 1.1*0.02*5000050 | 1.4*0.02*5000050 | 1.7*0.02*5000050 | 1.4*0.02*5000050 |
| Alkalinity (mg/L) | 22 | 28 | 34 | 28 |
| Ocean Water | Test 1 | Test 2 | Test 3 | Average Values |
| Calculations | 6.5*0.02*5000050 | 7.8*0.02*5000050 | 7.7*0.02*5000050 | 7.3*0.02*5000050 |
| Alkalinity (mg/L) | 130 | 156 | 154 | 146 |
| Tap Water | Test 1 | Test 2 | Test 3 | Average Values |
| Calculations | 6.6*0.02*5000050 | 6.5*0.02*5000050 | 6.7*0.02*5000050 | 6.6*0.02*5000050 |
| Alkalinity (mg/L) | 132 | 130 | 134 | 132 |
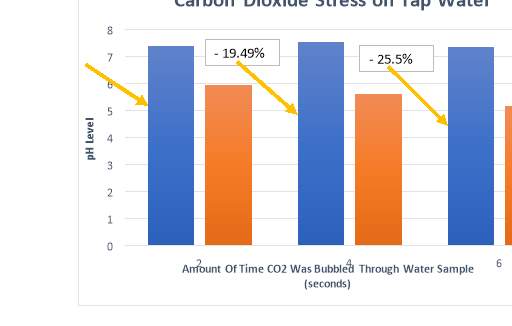
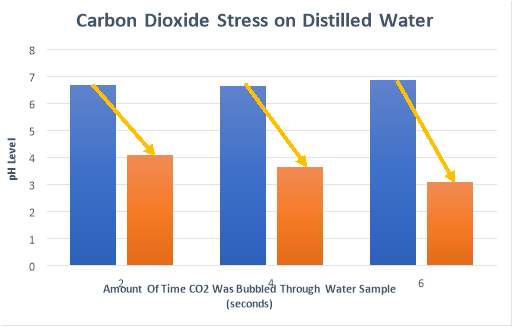
 Appendix 3-
The results for each trial conducted with carbon dioxide gas added as a stress, with calculations for percentage decrease of pH.
| DISTILLED WATER | 2 sec | 4 sec | 6 sec |
| Start -1 | 6.57 | 6.45 | 6.74 |
| End -1 | 4.12 | 3.76 | 3.08 |
| Start -2 | 6.78 | 6.88 | 7.03 |
| End -2 | 4.06 | 3.57 | 3.12 |
| Start Average | 6.68 | 6.67 | 6.89 |
| End Average | 4.09 | 3.67 | 3.1 |
| % Decrease | 38.77 | 44.98 | 55.01 |
| TAP WATER | 2 sec | 4 sec | 6 sec |
| Start -1 | 7.36 | 7.42 | 7.23 |
| End -1 | 5.92 | 5.78 | 5.23 |
| Start -2 | 7.42 | 7.63 | 7.51 |
| End -2 | 5.98 | 5.43 | 5.14 |
| Start Average | 7.39 | 7.53 | 7.37 |
| End Average | 5.95 | 5.61 | 5.19 |
| % Decrease | 19.49 | 25.5 | 29.58 |
| OCEAN WATER | 2 sec | 4 sec | 6 sec |
| Start -1 | 7.47 | 7.25 | 7.82 |
| End -1 | 6.62 | 6.19 | 4.73 |
| Start -2 | 7.54 | 7.42 | 7.63 |
| End -2 | 6.23 | 5.87 | 4.98 |
| Start Average | 7.51 | 7.34 | 7.73 |
| End Average | 6.43 | 6.03 | 4.86 |
| % Decrease | 14.38 | 17.85 | 37.13 |
You have to be 100% sure of the quality of your product to give a money-back guarantee. This describes us perfectly. Make sure that this guarantee is totally transparent.
Read moreEach paper is composed from scratch, according to your instructions. It is then checked by our plagiarism-detection software. There is no gap where plagiarism could squeeze in.
Read moreThanks to our free revisions, there is no way for you to be unsatisfied. We will work on your paper until you are completely happy with the result.
Read moreYour email is safe, as we store it according to international data protection rules. Your bank details are secure, as we use only reliable payment systems.
Read moreBy sending us your money, you buy the service we provide. Check out our terms and conditions if you prefer business talks to be laid out in official language.
Read more