Matt Cramb
The experiment explored the story of gravity, how it was discovered and derived from observations and experimentations, and attempted to recreate those initial tests. This was done to determine whether an increase in mass will increase the force of gravity, a statement which was supported by the experimental data, despite the numerous flaws inherent in the experimental design.
Gravity is one of the four fundamental forces of nature, and Nave, R (2017) also explains that it is the force responsible for constructing and regulating the movement of galaxies, stars, and planets.
In 1687, Isaac Newton formulated his famous Equation of Universal Gravitation based, purported by Physics Classroom (2016), on an injury in an apple orchard. Whatever the circumstances, it had far reaching impacts on the science of the time. But something crucial was missing from his equation.
 Newton knew from scientists before him that the force exerted by gravity grew weaker as distance between objects affected by gravity increased, or represented mathematically;

Where:

This was nothing new for science of the time, but Newton’s major discovery was that of the universality of gravity, which indicated that all objects which possess mass also exerted gravitational forces. This discovery led to another addition to the equation, because Kurtus, R (2016) reports Newton realized that objects with less mass exerted weaker gravitational forces.
 Therefore, he postulated that;

Where:

To convert this theory into an equation, Newton only needed one more piece. A constant was needed to calculate the exact gravitational forces on objects. This constant was called the gravitational constant, or G.
 In the equation, G presents as follows:

However, the value for G wasn’t found until much later, by Lord Henry Cavendish, over a century later.
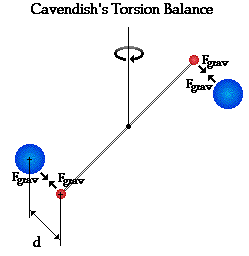
In Cavendish’s experiment, according to Shectman, J (2003) two spheres were attached at opposite ends of a beam which is suspended from the ceiling of a custom-built shed by a thin wire. Masses are placed to the sides of the spheres, to attract them, exerting gravitational forces sufficient to rotate the beam to a measurable degree. Cavendish measured the movement of the beam using a telescope positioned far from the shed.


To use this apparatus to calculate G, a formula must be created, using torque, oscillation period, torsion constant, inertia and gravitational forces.
 The torque on the beam can be measured by the angle of deflection of the torsion wire, using Hooke’s Law:

Where:

 However, torque can also be measured by the following expression:

Where:

 Torque can also be calculated as a vector product with this equation:

Where:

And because, in this experimental setup, r and F are perpendicular vectors, there are two F, and r is half the length of the beam:

Combining these two formula together results in the following:

From Newton, the formula for force was also known, and could be substituted in from above.

 The torsion constant was measured by Cavendish by disturbing the beam, then measuring the period of oscillation. This can be done using the below equation.

Where:

 This moment of inertia can be calculated from the sum moments of the two spheres at each end of the beam.
 The moment of inertia for each sphere is calculated by the equation:

Since each sphere had equal mass, the total I is equal to:


Inserting this into the period formula and rearranging for the torsion coefficient gives:

When inserted into the formula for torsion coefficient above, gives the following:


With this equation, the measurements needed to be taken from the experimental apparatus are:
|
Variable: |
Explanation: |
Units: |
|
|
|
m |
|
|
|
Rad |
|
|
|
m |
|
|
|
kg |
|
|
|
s |
Using the experimental setup described above, according to Kurtus, R (1997) Cavendish determined:

For this experiment, two previous iterations of the experiment were run. The first was to determine the validity of running such an experiment, and the second was a full-scale experiment which provided no useful data.
The first experiment was done using a meter-long beam and tennis balls attached to either end. A laser beam reflected off a mirror attached to the torsion wire, giving a result of angle.
However, in practice, this rig did not come to a final resting position so that the period of oscillation could be measured. Instead the torque already present in the twine torsion wire twisted the beam against a chair leg, preventing it from fully coming to a balance of forces.
The second experiment had results as follows:
|
Variable: |
Explanation: |
Units: |
Results: |
|
|
|
m |
1.25Ã-101 |
|
|
|
Rad |
9.0Ã-10-2 |
|
|
|
m |
1.765 |
|
|
|
kg |
1.6 |
|
|
|
s |
2.25Ã-102 |
|
|
|
m3kg-1s-2 |
2.419Ã-102 |
The value for G calculated by this experiment was vastly different to Cavendish’s value of  . This meant the experiment was concluded to be not statistically valid, for a variety of reasons.
These experiments were refined and transformed into the final experimental setup.
Using Newton’s formula for each of the three experiments which will be conducted can determine the value for  .
.

To do this, the masses and distance must be known ahead of time. These can be found below, and copied in the results section.
|
OBJECT |
MASS (kg) |
|
Mass of Sinkers |
|
|
Mass of Cup 1 |
|
|
Mass of Cup 2 |
|
|
Mass of Bowling Pins |
|

Using Cavendish’s above listed value of G, the projected data can be calculated.

|
MASS (kg) |
FORCE OF GRAVITY ( |
|
|
|
|
|
|
|
|
|
|
|
|
Later, these will be compared with the experimental data.
Based on the above background research, the magnitude of gravity in the system will increase proportional to an increase in the mass of the large masses.

Or, as  increases,
  will proportionally increase.
This hypothesis has been supported by the background research, which has guided its creation through empirical data, and researched phenomena.
However, because of the precision required to obtain an accurate result, research indicates the final calculated measurement for G will be vastly different from the real value.
25.5cm support beam
12cm length of fishing line
2x sinkers of mass 3.28g
2x plastic cups
2x bowling pins of mass 1.6kg
1x stopwatch
1x ruler
1x camera
1x plastic storage box approx. 70cm x 40cm
1m2 wire mesh
Before the experiment was conducted, a thorough risk assessment planner was completed and approved. Measures were taken to ensure no harm came to experimenter through heavy masses falling or water causing a slipping hazard.
These measures included:
A risk assessment matrix provided by the Department of Education (2017) was also completed.
|
Likelihood |
Consequence |
||||
|
Insignificant |
Minor |
Moderate |
Major |
Critical |
|
|
Almost Certain |
Medium |
Medium |
High |
Extreme |
Extreme |
|
Likely |
Low |
Medium |
High |
High |
Extreme |
|
Possible |
Low |
Medium |
High |
High |
High |
|
Unlikely |
Low |
Low |
Medium |
Medium |
High |
|
Rare |
Low |
Low |
Low |
Low |
Medium |
The likelihood of injury was unlikely, as experimenter has previous experience. The consequence was also minor, indicating injuries not requiring medical attention (i.e. bruises, minor cuts). Therefore, the total risk was low, which indicates no further control measures need be put into place. However, in due diligence the above measures were still implemented.
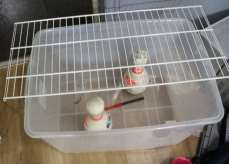
Firstly, to limit air flow; a major disturbance in the preliminary trials, the system was constructed inside a large plastic storage container. This container was placed a distance away from walls, to reduce the effects of other gravity sources.
Then, two sinkers, whose masses were known, were attached to either end of a support beam, which was hung from the top of the box by a length of fishing line. This was suspended by the wire mesh atop the box.
The fishing line was chosen as twine had been used in preliminary trials as the torsion wire, and had been shown to not be effective due to the latent torque.
After letting the system come to a complete rest, it was disturbed by gently pushing one end of the support beam. The period of oscillation was measured by a stopwatch. To further reduce misrepresentation of data, six measurements were taken and averaged.
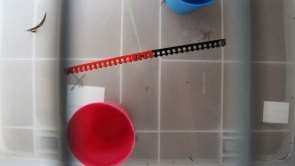
The system was then allowed to come to rest again, and a measurement of the rest position taken by a camera from above. This would eliminate the need to reach into the box to take measurements and thus disturb the experiment. It also provided clearer results.
Then, the two cups were introduced to the system 6.25cm away from the end of the support beam, at opposing sides and ends, so the attractive forces of the masses rotated the beam. The cups were initially filled with 250g of water, then 500g, then the cups were swapped with the 1.6kg bowling pins.
Each iteration of the experiment, when the system came to rest for a third time, a measurement of the final rest position was taken using the camera.
This data was recorded and processed by comparing photographs of the different rest positions and calculating angle of deflection. The results were then tabulated.


Images of the experimental setup.
|
OBJECT |
MASS (kg) |
|
Mass of Sinkers |
|
|
Mass of Cup 1 |
|
|
Mass of Cup 2 |
|
|
Mass of Bowling Pins |
|
|
TEST NUMBER |
PERIOD (s) |
|
1 |
20 |
|
2 |
22 |
|
3 |
21 |
|
4 |
21 |
|
5 |
21 |
|
6 |
21 |
|
Avg. |
21 |
|
TEST NUMBER |
MASSES USED |
ANGLE OF DEFLECTION (Rad) |
|
1 |
No mass used |
0.00 |
|
2 |
Cup 1 |
9.65 |
|
3 |
Cup 2 |
3.31 |
|
4 |
Bowling Pins |
1.00 |
|
Variable: |
Explanation: |
Units: |
Results: |
|
|
|
m |
0.0625 |
|
|
|
m |
0.255 |
Using Newton’s formula for each of the three experiments will determine the value for  .
.

Firstly, the value for G for each equation must be calculated.
|
MASS (kg) |
VALUE OF G ( |
|
|
|
|
|
|
|
|
|
|
|
|
Now the force for gravity can be calculated.
|
MASS (kg) |
FORCE OF GRAVITY ( |
|
|
|
|
|
|
|
|
|
|
|
|
The experiment shows that using Cavendish’s method to determine the value for G was flawed, but that the experiment could have obtained an accurate value for G.
These flaws will be examined below, but a basic rundown and description of data obtained will be given here.
As can be seen by the graph at the end of the results section, the magnitudes of gravity measured do not accurately match the theoretical data obtained.
These values, and the values for G, are vastly different to that originally measured by Cavendish (found in background research), likely because of the various flaws in the experimental design, which will be discussed in the Evaluation section.
However, the results far more accurately correlate to the theoretical values than those in previous experiments, and the average trendlines do indicate that the trend matches that predicted.
At 250g, the first mass, the experimental data differs wildly from the theoretical.
|
Experimental Data |
Theoretical Data |
|
|
|
At 500g, the second mass, it drastically spikes, much higher than either of the other points.
|
Experimental Data |
Theoretical Data |
|
|
|
At 1600g, the final point, the data dips down lower than expected again.
|
Experimental Data |
Theoretical Data |
|
|
|
It’s unclear from the background research conducted whether Cavendish’s data deviated so much, but he also had a larger rig, which as discussed below, may have helped his experiment’s accuracy.
The average period measured was 21 seconds, which is far shorter than the fifteen minutes measured by Cavendish. This is probably mostly due to the shorter beam, the effect of which can be seen with the torsion coefficient formula derived from the background research.

The squared length of the beam demonstrates an exponential relationship between the torsion coefficient, an increase in which will decrease the period, which can be seen in the following formula for period of oscillation:

The equipment used to measure the period of oscillation may not have changed in the two hundred years since Cavendish’s original experiment, however all other recording equipment did. A camera and digital analysis was used to take measurements, which may have causes slight issues with the orientation of frames in the software, but overall was more accurate than taking the measurements by hand when compared to the preliminary tests when this was done.
The lengths were taken with a tape, and so were only calculated to two decimal places. However, this will likely not impact greatly on the results of the experiment, which can be shown mathematically.
Using the same formula as above, and two length measurements as given below, the difference can be theorised.
|
cm |
Value for k |
K (2 decimal places) |
|
|
Length 1 (two decimal places) (given by experiment) |
6.25 |
2.35497 |
2.35 |
|
Length 2 (six decimal places) |
6.247832 |
2.35334 |
2.35 |
There are several reasons for why the value for G determined by this experiment differed so greatly from Cavendish’s value, and these expose various flaws and strengths in the original design. They will be examined each using the following method:
Various opportunities for error arose when observing and recording data in the experiment. Most of these examples, such as misreporting the period of oscillation by a fraction, would have a m
You have to be 100% sure of the quality of your product to give a money-back guarantee. This describes us perfectly. Make sure that this guarantee is totally transparent.
Read moreEach paper is composed from scratch, according to your instructions. It is then checked by our plagiarism-detection software. There is no gap where plagiarism could squeeze in.
Read moreThanks to our free revisions, there is no way for you to be unsatisfied. We will work on your paper until you are completely happy with the result.
Read moreYour email is safe, as we store it according to international data protection rules. Your bank details are secure, as we use only reliable payment systems.
Read moreBy sending us your money, you buy the service we provide. Check out our terms and conditions if you prefer business talks to be laid out in official language.
Read more