|
Recycling Waste generated in my home Andrew Connor Cowan |
What is the amount of waste produced by my household
Over 42 million cubic meters of general waste is generated every year across the country, with the largest proportion coming from Gauteng (42%). In addition, more than 5 million cubic meters of hazardous waste are produced every year, mostly in Mpumalanga and KZN due to the increase of mining activities and fertilizer production.
The amount of waste generated by the average South African is ± 0.7 kg’s. Which means the average 4 person families produces ± 2.8 kg’s a day. But the largest contributors to the solid waste stream by far is mining waste (± 72.3%), followed by pulverized fuel ash (± 6.7%), agricultural waste (± 6.1%), urban waste (± 4.5%) and sewage sludge (± 3.6%).
Estimated decomposition rates of most debris found in landfills are:
[figure 1.1 in appendix 1]
The percentage contribution of each waste stream to the composition of general waste is illustrated in Figure 1 [Appendix 3]. Non-recyclable municipal waste contributes 34% (by weight) of the overall general waste, construction and demolition waste, 21%, followed by metals (14%), organic waste 13% and mainline recyclables (including paper, plastics, glass and tyres )(18%). {See reference page Ref. … for sourcing}
My family produces a average amount of waste.
The aim of this experiment is to view and record my households daily waste generation and compare it to the average waste production of the average South African family.
I have to say that my results are inconclusive because my findings fluctuate and I was unable to undertake more tests.
To improve my results I would Extent the testing period to about least 5 months instead of 3 weeks to view if the results change according to season
My household recycles ± 95% of all of its recyclable materials and all organic materials are either fed to the animals or are thrown onto a compost heap (apart from bones)
My family will soon institute a policy of cutting down on the amount of Non-recycleable materials purchased


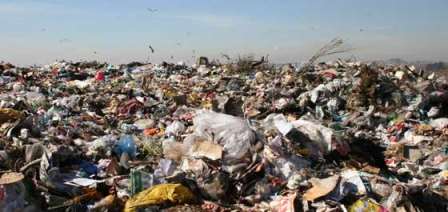
Figure 1.1: Johannesburg city landfill
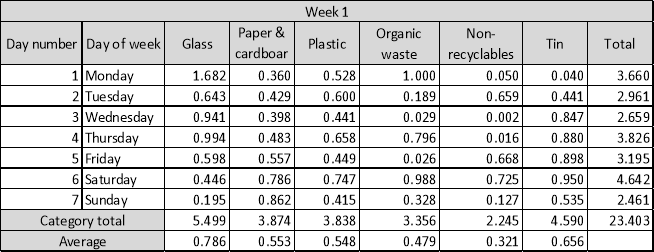
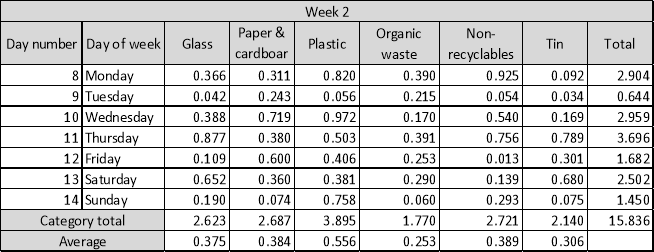
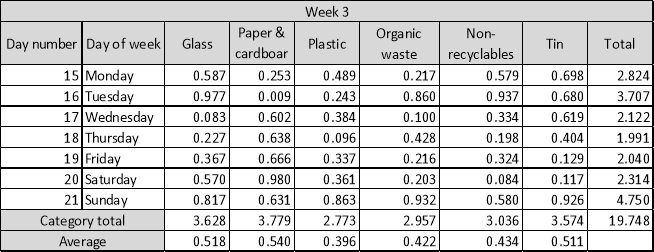
 The following tables contain the results of the experiment all measurements are in kilograms


 Figure 3.1 [The waste composition for general waste, 2011 (percentage by mass), other, which is mainly biomass waste from industrial sources)
 ] {See reference page Ref 1 for sourcing}
 Graph and percentages have been adapted from the national waste information baseline report draft 6, 5 September 2012 Published by: Department of Environmental Affairs
You have to be 100% sure of the quality of your product to give a money-back guarantee. This describes us perfectly. Make sure that this guarantee is totally transparent.
Read moreEach paper is composed from scratch, according to your instructions. It is then checked by our plagiarism-detection software. There is no gap where plagiarism could squeeze in.
Read moreThanks to our free revisions, there is no way for you to be unsatisfied. We will work on your paper until you are completely happy with the result.
Read moreYour email is safe, as we store it according to international data protection rules. Your bank details are secure, as we use only reliable payment systems.
Read moreBy sending us your money, you buy the service we provide. Check out our terms and conditions if you prefer business talks to be laid out in official language.
Read more